Do Solar Panels Work in Winter in Ireland? Monthly Output and Savings
Yes, solar panels generate electricity through the Irish winter, but winter accounts for a much smaller share of annual output. Compare modelled monthly generation for 4, 6 and 8 kWp systems, winter electricity demand, Irish locations, batteries and realistic payback.
 Wealth / The Compound journal
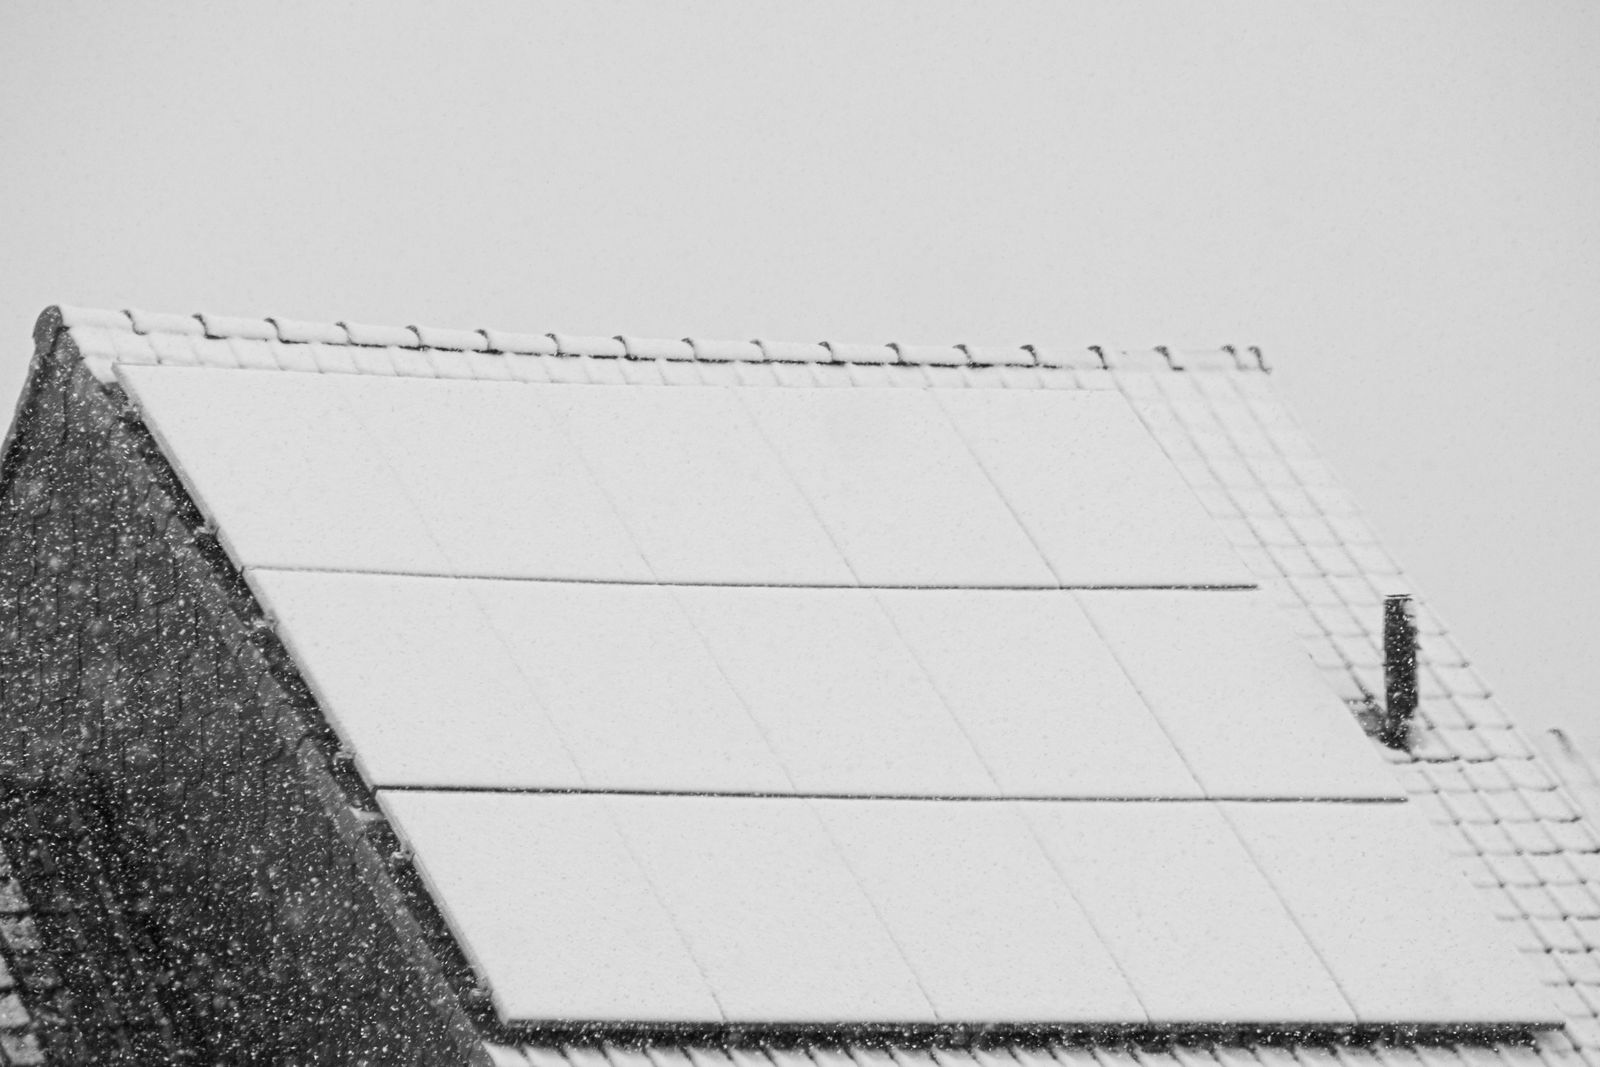
Photo: Budget Bizar / Pexels (Belgium; illustrative winter photograph) · Illustrative image.
THE QUICK ANSWER · IRELAND · UPDATED OCTOBER 2026
Yes, solar panels work in winter in Ireland. But they produce far less electricity in December and January than in late spring or summer. A published PVGIS-based Dublin reference profile, scaled to a 4 kWp system, suggests roughly 136 kWh in December, 151 kWh in January and 502 kWh in May. These are long-term modelled averages, not guaranteed bills savings or a forecast for this coming winter.
Want the financial answer for your own roof? Start with the Solar Payback Calculator, then use the Compound Solar Hub to check grants, battery economics and installer quotes.
Winter is the question that can stop an Irish homeowner from buying solar panels: What is the point of generating electricity when the sun barely comes out and the heating bill is highest?
The answer is about the whole year, not one December week. Solar electricity is generated in winter daylight—even with cloud cover—but the shorter days, lower solar angle and more frequent shading reduce total production. A battery can shift output from afternoon to evening; it cannot move the excess electricity from June into January.
The question is therefore how much solar you can use or export over 12 months, what it costs to install and how much you still need to buy from the grid in winter.
1. How much electricity can solar panels produce each month in Ireland?
This comparison scales a publicly published Dublin PVGIS-based 10 kWp monthly reference to 4, 6 and 8 kWp. The source assumes a south-facing array, 35° tilt and 14% system losses, with a multi-year climate average. Compound has recalculated and visualised the values; we did not query the PVGIS API independently for this article.
| Month | 4 kWp | 6 kWp | 8 kWp | Pattern |
|---|---|---|---|---|
| January | 151 kWh | 226 kWh | 302 kWh | Winter |
| February | 216 kWh | 324 kWh | 432 kWh | Winter |
| March | 353 kWh | 529 kWh | 706 kWh | Shoulder |
| April | 441 kWh | 661 kWh | 882 kWh | Shoulder |
| May | 502 kWh | 752 kWh | 1,003 kWh | Peak season |
| June | 468 kWh | 703 kWh | 937 kWh | Peak season |
| July | 455 kWh | 683 kWh | 910 kWh | Peak season |
| August | 417 kWh | 625 kWh | 834 kWh | Peak season |
| September | 351 kWh | 526 kWh | 702 kWh | Peak season |
| October | 260 kWh | 389 kWh | 519 kWh | Shoulder |
| November | 181 kWh | 272 kWh | 362 kWh | Shoulder |
| December | 136 kWh | 205 kWh | 273 kWh | Winter |
| Year (approx.) | 3,930 kWh | 5,896 kWh | 7,861 kWh | Same roof assumptions |
Important: the 10 kWp source publishes monthly values rounded to whole kWh. Summing those published values gives 9,826 kWh versus the source’s separately rounded 9,824 kWh annual estimate. Scaling and rounding are why the annual rows above are approximate. These are model estimates, not measured generation from a real Irish house. The gain from 4 to 8 kWp may not double on an actual roof if panel orientations, shade or inverter limits change.
The three numbers that explain the winter problem
| Four-kWp Dublin reference | Modelled generation |
|---|---|
| December–February combined | 503 kWh |
| Share of modelled annual generation in those three months | 12.8% |
| May versus December | About 3.7 times as much |
SEAI’s broad public guidance says around 75% of solar electricity is produced from May to September. The specific Dublin PVGIS-derived reference used here places those five months at 55.8% of its annual total. Those figures differ markedly: do not treat the SEAI rule of thumb and this specific model run as interchangeable. For a purchase decision, request the month-by-month output of your actual roof from an installer or model the site yourself in PVGIS.
2. Will panels actually lower your electricity bill in December and January?
Yes, if the electricity offsets grid imports or is exported for payment. But a kWh generated is not automatically a kWh deducted from your bill at the full retail rate.
Consider a 4 kWp Dublin reference array and a household using an illustrative 650 kWh of electricity per month across December, January and February:
The three winter months together would use 1,950 kWh in this example. The array would generate around 503 kWh. Even in the physically unrealistic best case where every generated kWh coincided with demand, it could cover at most around 26% of that winter total. In reality, daylight mismatch and exports can reduce the share actually consumed at home.
This illustrates why a house can enjoy substantial annual solar savings and still receive large winter bills. Standing charges and other fixed tariff components also remain.
For your own demand, check your smart-meter or supplier’s monthly kWh data, use our Average Home Electricity Use in Ireland guide, then compare seasonal bills with the Electricity Cost Calculator.
3. What are the actual winter savings in euros?
Here is an example with 30 c/kWh avoided grid-import cost and 18 c/kWh export payment. These are assumptions for illustration, not verified current supplier rates. Suppose half of December’s approximately 136 kWh is used directly and half exported:
- About 68 kWh used in the home × €0.30 = €20.40 in avoided unit charges.
- About 68 kWh exported × €0.18 = €12.24 in export income.
- Combined December electricity value = about €32.64.
If you managed to use all 136 kWh, the energy-only value at 30 c/kWh would be €40.80. If all of it were exported at 18 c/kWh, it would be €24.48. These are limiting examples, not predictions of a typical home’s self-consumption fraction.
The economics depend on your day rate, night rate, export credit, when appliances run and how much solar is available. Our Solar Export Rate Comparator checks import prices and export payments together.
4. Which parts of Ireland produce the most solar electricity in winter?
Irish geography matters, but an east-facing unshaded roof in one county can outperform a shaded south-facing roof in another.
The following figures are city reference points, not whole-county averages. They use GridPassport’s published PVGIS-based model with the same 10 kWp, due-south, 35° tilt and 14% loss setup. Compound scales each annual estimate to a 4 kWp system for a consistent comparison.
| Irish reference location | Approximate annual 4 kWp output | Compared with Dublin |
|---|---|---|
| Wexford | 4,326 kWh | +10% |
| Cork | 3,976 kWh | +1% |
| Dublin | 3,930 kWh | Reference |
| Navan | 3,787 kWh | −4% |
| Galway | 3,705 kWh | −6% |
| Letterkenny | 3,388 kWh | −14% |
This is a comparison across six selected location models, not a ranking of all Irish counties or predictions of the same roof’s annual bills. The modelled cities span different coastal and inland climates; microclimate, roof slope and shading can change your result more than moving a few kilometres.
What about December specifically? The same source’s monthly profiles suggest about 136 kWh in Dublin, 138 kWh in Wexford, and 110 kWh in Galway for a 4 kWp system in December. Wexford has a stronger annual reference, but that does not mean the gap is equally large every winter month.
To compare the exact roof in your Eircode area, use the European Commission PVGIS tool and ask installers to share the inputs behind their estimates.
5. Why winter output falls even though solar panels still work in cold weather
Shorter days. Winter gives each panel fewer hours of daylight in which to generate electricity.
Lower sun angle. The sun sits lower in the sky, so roof geometry and nearby obstacles become more important.
Shading. Chimneys, dormers, neighbouring roofs and trees may obstruct sunlight for longer periods when the sun is low.
Weather variability. A bright cold day can produce useful output; a dark rainy day may produce very little. A monthly climate average is not a guaranteed minimum.
Snow or frost. Irish conditions vary. Snow can obstruct panels, while frost and cold temperatures alone are not evidence that a panel has stopped generating. The cover image shows an illustrative snowy European roof, not a typical Irish-weather prediction.
If your house has a split roof, see our East- vs West-Facing Solar Panels guide for the interaction between roof direction and the timing of demand.
6. Would installing 6 or 8 kWp instead of 4 kWp solve winter bills?
A larger array generally raises potential winter production, provided the extra panels have comparably productive roof space. In the Dublin reference, scaling the December total produces about:
| System size | Modelled December output | Theoretical maximum share of 650 kWh December demand |
|---|---|---|
| 4 kWp | 136 kWh | 21% |
| 6 kWp | 205 kWh | 32% |
| 8 kWp | 273 kWh | 42% |
Those percentages are ceilings based solely on monthly energy totals: they assume perfect timing and every solar kWh consumed at home. They are not projected self-consumption rates.
Going bigger also costs money, and increased summer generation might be exported at a lower unit value than imports avoided. Choose size based on annual usage, daily patterns, roof potential, quote price and the import/export tariff split. Read 4 kWp vs 6 kWp vs 8 kWp in Ireland and compare installer assumptions in the Solar Quote Calculator.
7. Does a home battery make Irish winter solar worthwhile?
A home battery can store some electricity generated in daylight and discharge it later, subject to usable battery capacity and charging/discharging losses.
What it cannot do is carry excess summer generation forward for months. If the roof generates very little on a dull December day, the solar battery has very little solar electricity to store. Some households can also charge a battery on an off-peak electricity tariff, but that is a separate tariff-arbitrage calculation rather than free solar power.
An illustrative 5 kWh battery that receives only 2 kWh of spare solar energy on a winter day cannot create 5 kWh of solar supply: the shortage is generation, not storage capacity. Export income forgone and the battery’s installed cost also matter.
SEAI now lists a separate €600 grant for qualifying batteries of at least 5 kWh, subject to scheme conditions and approval before work starts. Check the grant checker and model the battery’s incremental economics in the Battery Payback Calculator rather than assuming every grant-backed battery is worthwhile.
8. Can solar panels make financial sense if December performance is poor?
Often, yes—but the answer must come from annual net cash value, not just the highest monthly output.
Here is a simplified 4 kWp illustrative investment, with no battery:
| Input | Example assumption |
|---|---|
| Installed price before grant | €9,000 |
| Illustrative eligible SEAI solar PV grant | €1,800 |
| Net cost after assumed grant | €7,200 |
| Modelled annual Dublin 4 kWp output | ~3,930 kWh |
| Share consumed directly in the home | 35% |
| Avoided import unit price | 30 c/kWh |
| Export income unit rate | 18 c/kWh |
| Modelled annual energy-only benefit | ~€873 |
| Simple payback | ~8.3 years |
Formula: annual modelled kWh × (35% × €0.30 + 65% × €0.18), followed by €7,200 ÷ annual value.
This is not a quote or a forecast. It assumes every modelled kWh is either self-consumed or compensated at the stated export rate, excludes system degradation, downtime, inverter replacement, servicing, insurance, time value of money and future tariff changes, and assumes grant eligibility. A 35% self-consumption fraction is an example—not a claim about the average Irish home.
The important result is structural: winter production can be weak yet the year-round return can still be positive. Conversely, an expensive oversized system may offer disappointing payback despite high annual production.
Run your own numbers in the Compound Solar Payback Calculator, then obtain like-for-like quotes through the Solar Hub.
9. How to check your exact home in PVGIS
The European Commission’s PVGIS grid-connected calculator produces average monthly and annual output estimates using location, panel size, technology, slope, orientation and loss assumptions.
- Find your house on the map, or select your nearest suitable location.
- Enter peak installed capacity (kWp), e.g. 4, 6 or 8.
- Enter roof slope in degrees and orientation; PVGIS uses south = 0°, east = −90°, west = +90°.
- Enter an appropriate system-loss assumption. 14% is the reference used in the figures above, not a mandatory value.
- Review the monthly output chart and year-to-year variation, then compare it with your smart-meter usage for those same months.
- Check whether the installer has incorporated chimneys, tree shade, roof obstructions and inverter sizing. PVGIS’s general horizon treatment is not a substitute for a site-specific shading study.
Ask for the monthly kWh output, not just annual savings claimed in a brochure. The source of each output assumption should be explained.
10. Five questions to ask an installer about winter solar
- Can you show December, January and February production individually—not merely a year’s total?
- What are the roof-orientation, tilt, losses and shading assumptions behind those monthly estimates?
- How much electricity is likely to be used in my home versus exported, and what are the assumed import and CEG export rates?
- What would adding a battery cost after the applicable grant, and what incremental cash benefit does it add beyond solar-only?
- What happens to estimated payback if the installation quote rises by €1,000 or the export tariff falls?
The Solar Hub’s quote preparation tool generates a consistent brief to send to installers, and the Solar Quote Comparison tool makes competing proposals easier to assess.
Frequently asked questions
Do solar panels generate electricity on cloudy winter days?
Yes, panels can produce electricity using diffuse daylight, though output may be much lower than in bright conditions. Cloud cover and available daylight vary greatly from day to day.
What is the worst month for solar panels in Ireland?
In the specific published Dublin PVGIS-derived reference used here, December produces the least monthly electricity, with roughly 136 kWh for 4 kWp. Other sites and actual weather years can differ.
Can you run a heat pump on solar in December?
Solar generation can offset some of a heat pump’s consumption during daylight, but it should not be assumed to supply the full heating demand. Heating demand often rises just when solar output falls. See our Heat Pumps in Ireland guide and model actual winter usage.
Do I need a battery to benefit from solar in winter?
No. You can use solar electricity directly and may receive export payments for eligible surplus generation. Storage is an additional economic choice, not a prerequisite for PV output.
How do I calculate solar panel payback in Ireland?
Compare the net installed cost with your annual electricity import savings plus export value, accounting for time of use and costs. Use the Solar Payback Calculator with your real quote and tariff, not a flat national savings promise.
Editorial methodology (13 October 2026). Source data: GridPassport’s Dublin monthly PVGIS-based reference profile and Irish location profiles, published under CC BY 4.0 and attributed to GridPassport and the European Commission’s Joint Research Centre PVGIS climate series. Compound scaled their published reference output by installed kWp, computed ratios and euros, and created the original charts and scenarios above. We did not independently fetch a fresh PVGIS run for this article. Every financial tariff, winter household demand and installation price in our examples is expressly illustrative. This article is independent editorial content; calculators do not rank or recommend commercial installers.