East- and West-Facing Solar Panels in Ireland: Are They Worth It?
A roof does not need to face south to make solar PV useful. We compare east, west and south-facing panels using SEAI orientation data, show why household demand timing matters, and explain how to check a real quote with PVGIS.
 Wealth / The Compound journal
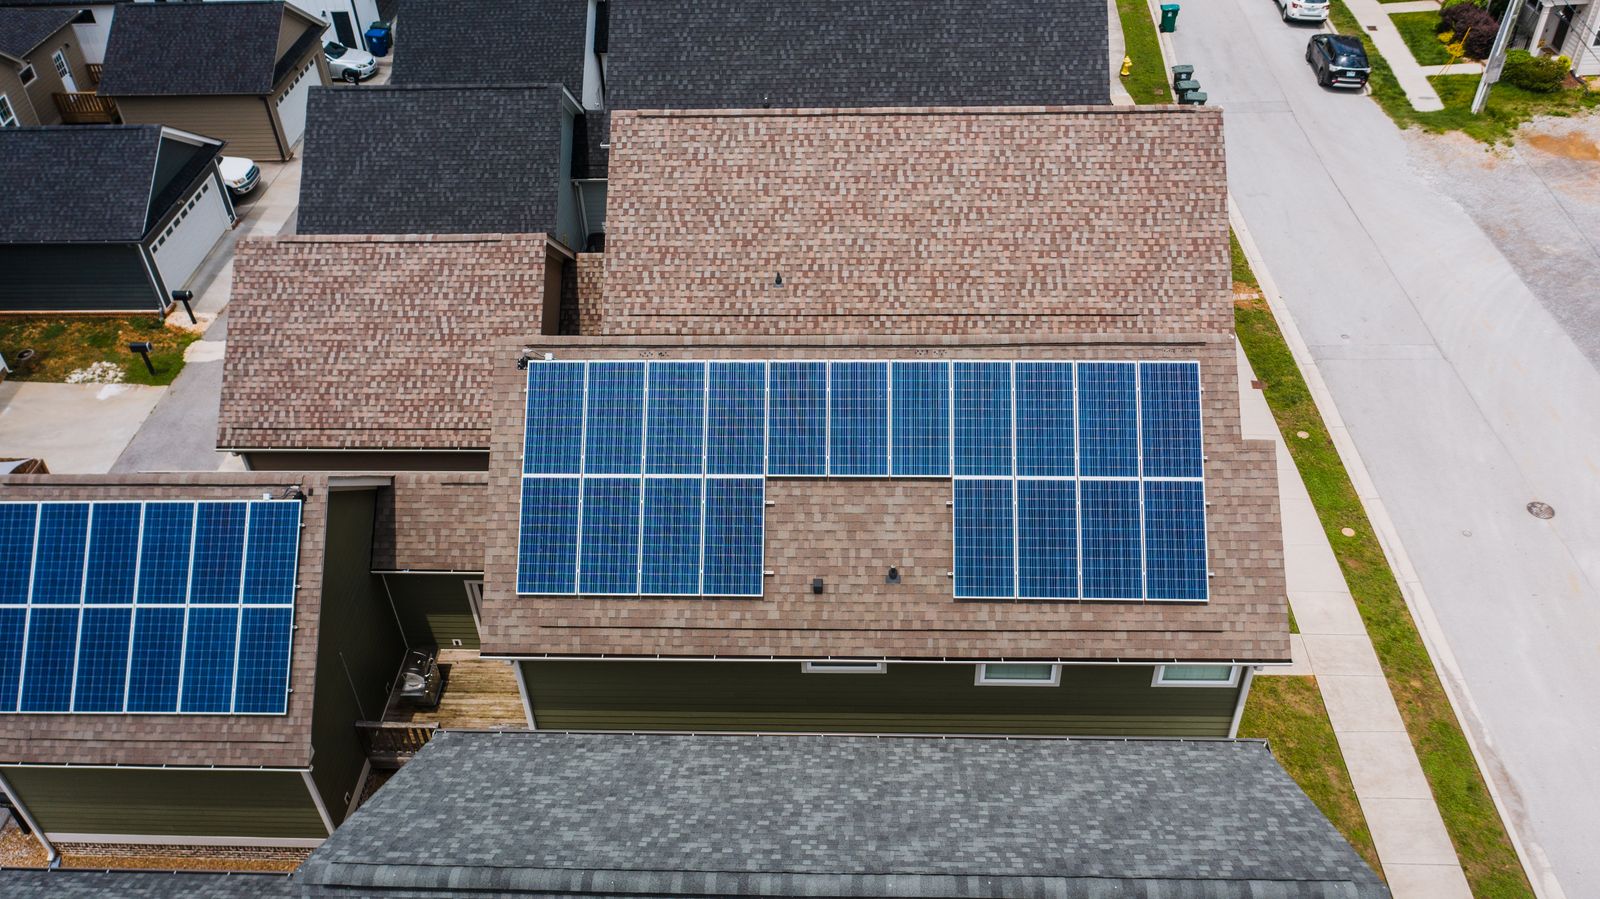
Photo: 8 K / Pexels · Illustrative image.
Quick answer · Ireland · October 2026
Yes. East- and west-facing roofs can be worth installing solar panels on. A south-facing, unshaded roof generally produces more electricity per installed kWp, but an east-west arrangement can shift generation towards the morning and evening. Whether that creates better household value depends on your electricity use, export payment, roof pitch, shade and installation price.
For an actual purchase decision, ask installers for roof-specific annual and hourly generation estimates, then test your quote with the Solar Payback Calculator and compare it in the Solar Hub quote tool.
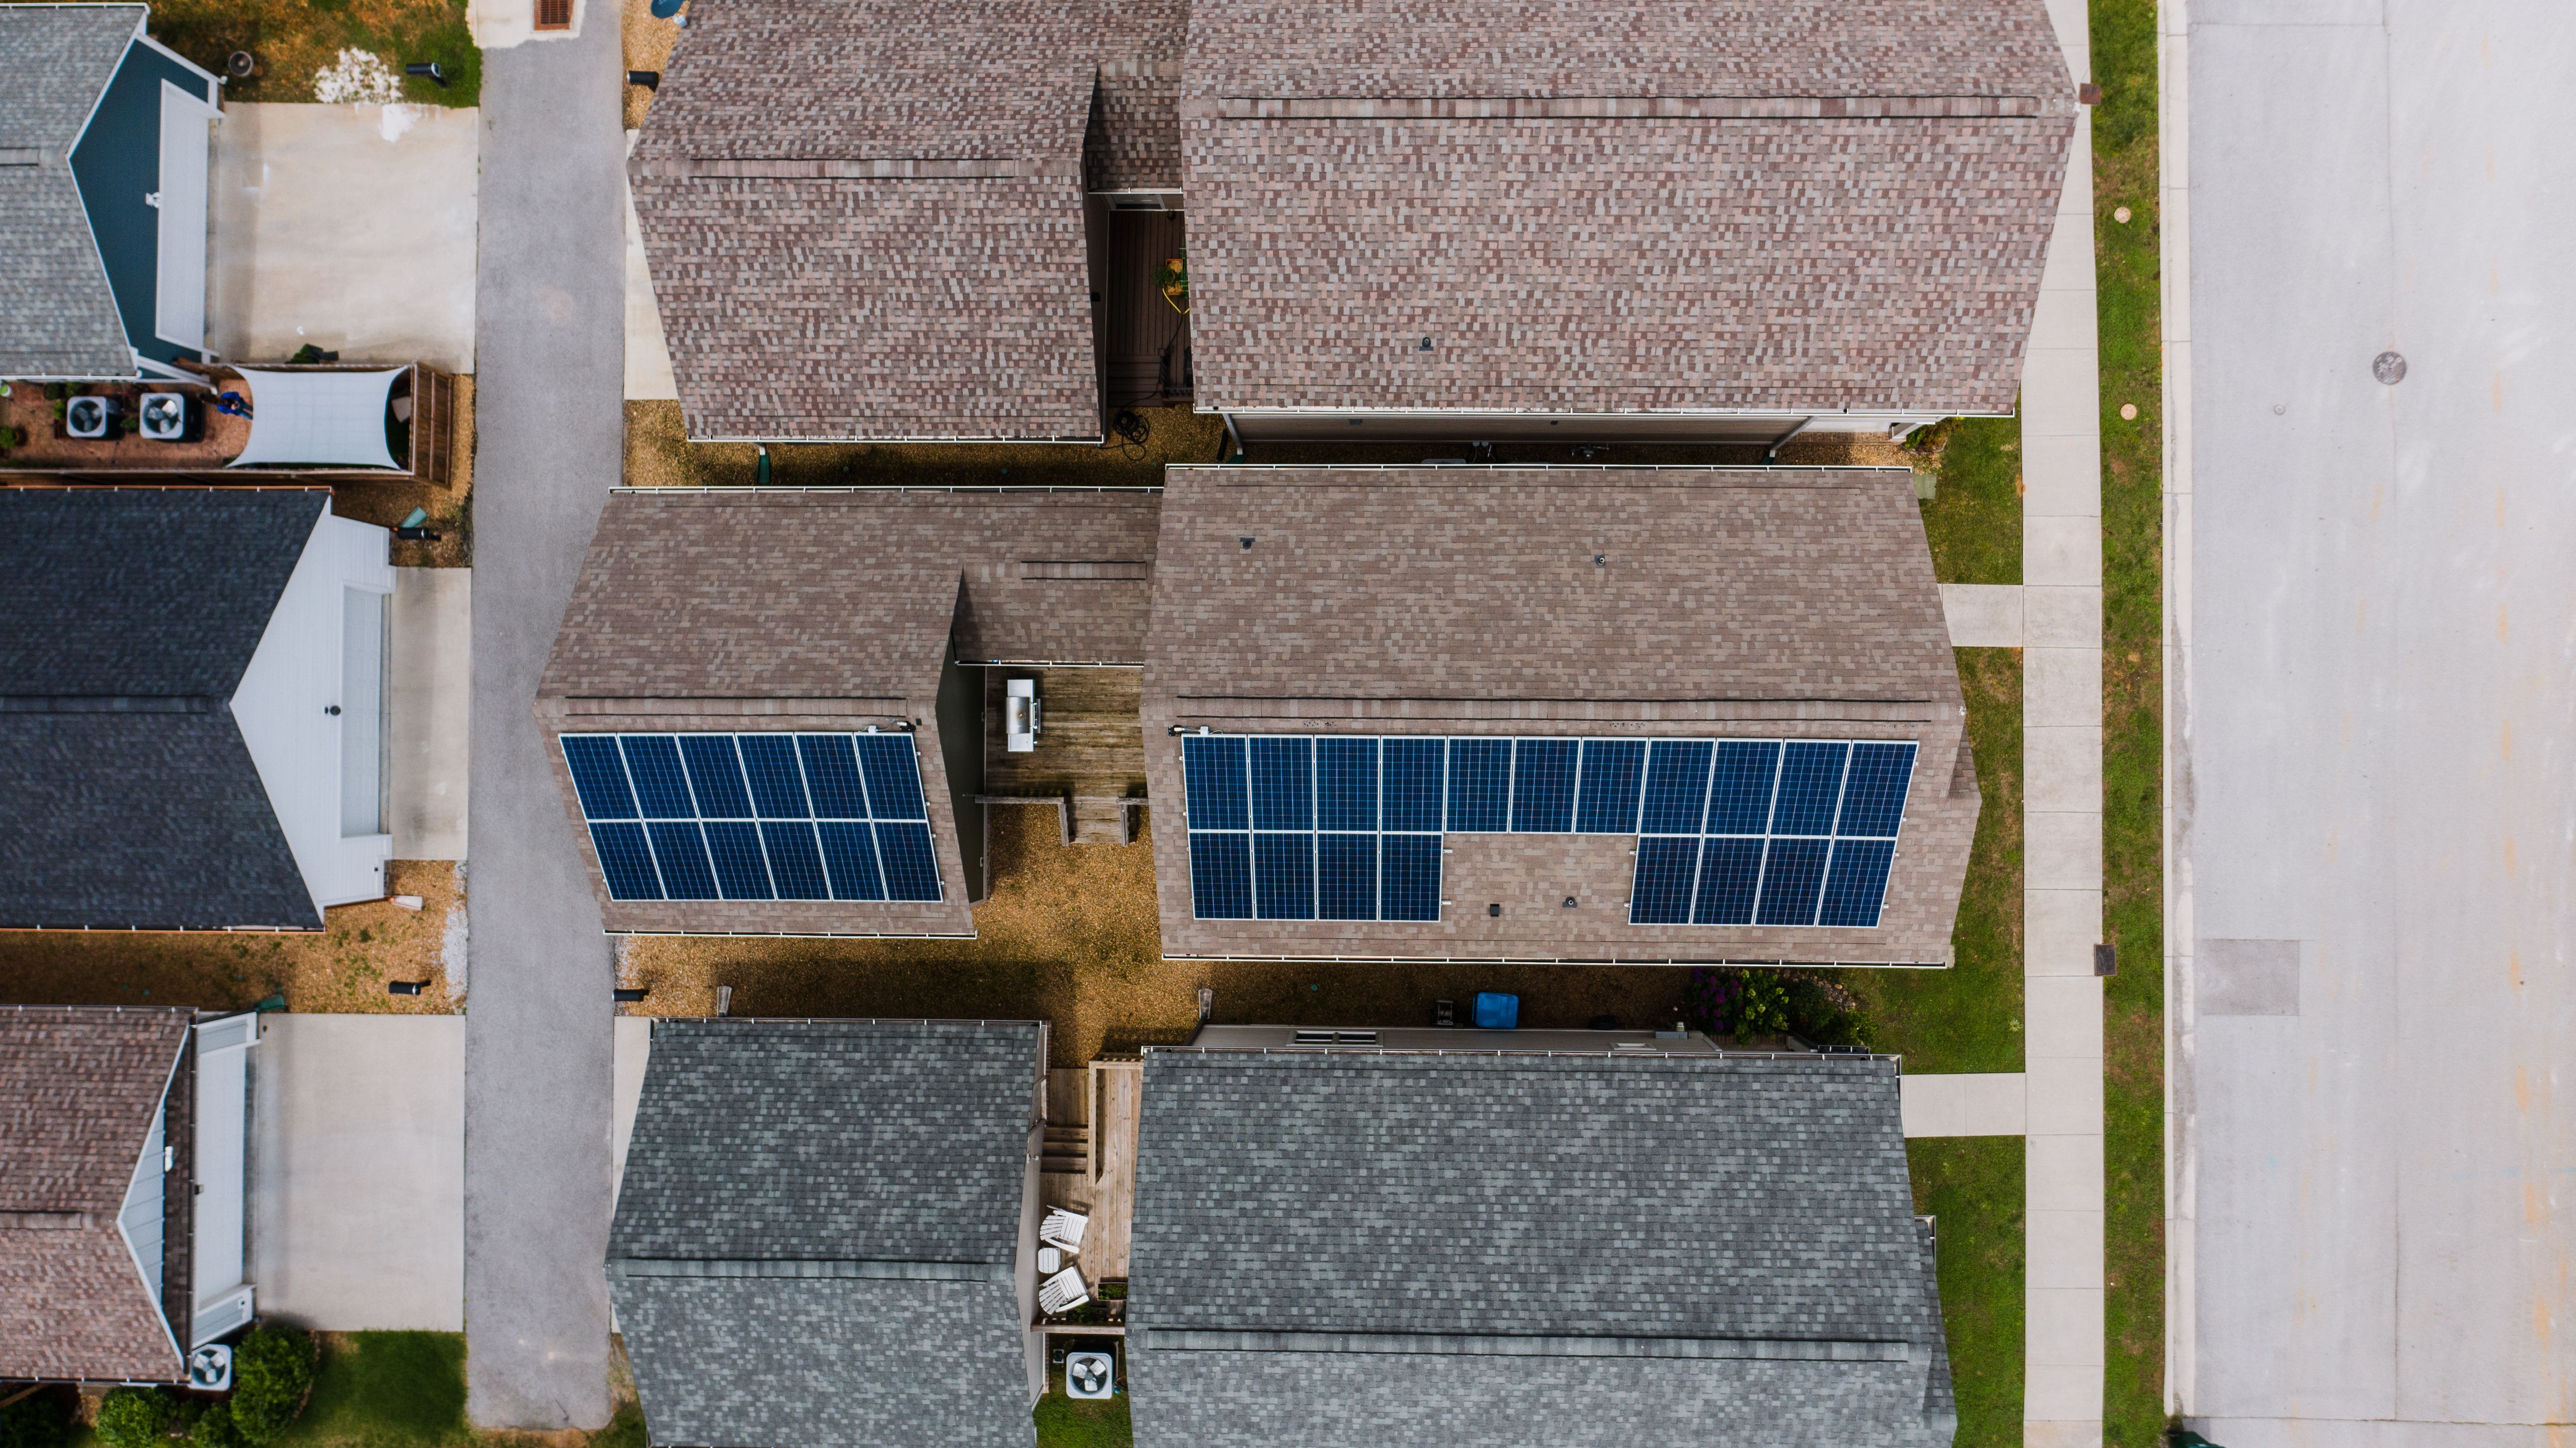
Many Irish houses have two usable roof slopes: one facing east and the other west. It is easy to assume that neither is suitable because the best-known solar layout faces south.
That assumption can lead to a mistake. South is the benchmark for annual generation, not automatically the cheapest electricity bill.
How much do east- and west-facing panels lose?
A useful, independently published reference is the orientation table reproduced in the SEAI-hosted Stoneybatter Energy Master Plan. For a 30° roof tilt, the table reports the following annual solar irradiation by aspect:
| Roof direction | Annual sunlight on tilted surface | Relative to south |
|---|---|---|
| South | 1,074 kWh/m² | 100% |
| South-east / south-west | 1,021 kWh/m² | 95% |
| East / west | 886 kWh/m² | 82% |
| North-east / north-west | 736 kWh/m² | 69% |
| North | 676 kWh/m² | 63% |
At the same 30° angle, the east/west value in that table is around 18% lower than south. This is a useful orientation comparison—not a promise that every east- or west-facing installation will produce exactly 82% of its south-facing counterpart.
Crucial distinction: irradiation, measured in kWh/m², is incoming solar energy. A PV system’s exported or consumed electricity is measured in kWh, after panel efficiency, temperature, inverter and other losses. Never relabel one as the other.
East versus west: the useful difference is timing
A south-facing array often has the strongest production around the middle of the day, assuming an unshaded roof. East-facing panels shift generation earlier, while west-facing panels shift it later.
| Roof arrangement | Typical generation emphasis | Potential fit |
|---|---|---|
| South | Midday | Homes able to use daytime power; strongest annual generation benchmark |
| East | Morning | Morning appliances and demand before leaving the house |
| West | Afternoon into evening | Households using more power after work, subject to season and daylight |
| Split east / west | Broader period, usually less of a midday peak | Demand spread through more of the daylight day |
These are directional patterns, not guaranteed hourly profiles. In winter, the sun sets earlier; a west-facing roof cannot provide evening electricity after sunset. Cloud cover, nearby trees and roof shadows may outweigh modest orientation differences.
A worked 4 kWp comparison (illustration, not an Irish yield forecast)
Suppose an installer models 3,600 kWh per year for a particular unshaded south-facing 4 kWp array. Applying the SEAI table’s irradiation ratio mechanically would give approximately 2,970 kWh for an equal-capacity east- or west-facing arrangement: a difference of roughly 630 kWh.
That number is a sensitivity illustration only. It is not an independent PVGIS result, because converting irradiation ratios directly into generated electricity ignores temperature, system losses, shade and orientation-dependent performance.
A 630 kWh difference would be worth:
- €113/year if every additional kWh would otherwise be exported at an illustrative 18 c/kWh.
- €202/year if every additional kWh would replace grid purchases at an illustrative 32 c/kWh.
- €158/year under a purely illustrative 50/50 split between those outcomes.
Notice how the same energy difference has different financial value depending on when the electricity is generated and what you do with it. A better east-west match to household consumption can offset some of the annual-generation disadvantage; it does not guarantee that it will.
For actual values, use your smart-meter usage pattern, current supplier tariff, export rate and real installer forecast. Our Solar Export Rates comparison shows why you should compare import and export pricing together.
How to compare your own roof using PVGIS
The European Commission’s free Photovoltaic Geographical Information System (PVGIS) models average annual and monthly electricity production for a chosen location, array size, tilt and orientation. It incorporates radiation and system factors instead of relying on a generic national percentage.
Run the following comparisons using the same location, PV module type, installed kWp and loss assumptions:
- Due south at your actual roof pitch.
- Due east at that same pitch.
- Due west at that same pitch.
- If your roof has two slopes, model an east array and a west array at their respective kWp sizes, then add their estimated annual output. Do not treat 4 kWp on each side as a 4 kWp total system.
In PVGIS, south is 0° azimuth, east is −90° and west is +90°. Take care: map compass bearings use a different convention and can reverse the input if copied directly.
PVGIS can provide monthly totals, but the orientation with the highest total output may not have the highest self-consumption value. For that you need demand data or an hourly comparison with your smart-meter readings. The PVGIS tool and JRC user manual explain the inputs.
Five questions to ask before paying for an east-west system
1. What is the annual output of each roof slope? Request predicted kWh by slope and for the combined system, not just a headline total.
2. What is the predicted monthly—and ideally hourly—generation? A system with more electricity during your household’s busy hours may reduce imports more effectively.
3. Is any roof shaded? Chimneys, dormers, trees and adjacent buildings can cause large losses at low morning or evening sun angles. Ask whether shading is modelled and how.
4. Are the inverter inputs designed for separate orientations? Ask whether the two roof planes use suitable MPPT arrangements, the consequences of mismatched modules and whether the quote includes required monitoring.
5. Is the quoted value based on self-use, exports or both? Check the export rate and assumed electricity-price inflation before trusting a short payback claim. Use the Solar Payback Calculator and the Quote Comparison tool to compare like for like.
Is a battery more valuable with an east-west array?
Possibly, but not automatically. An east-west arrangement can already extend the generation window and may reduce the amount of excess midday electricity available to store. A battery adds a separate cost, incurs round-trip losses and may replace export revenue you would otherwise have received.
Compare solar-only versus solar-plus-battery for the same roof, using the Solar Battery Calculator or Solar + EV Battery Optimiser. Check the current SEAI battery grant rules but do not treat grant eligibility as proof of good payback.
Is an east-west roof eligible for Ireland’s SEAI grant?
Roof direction alone does not automatically rule a home out of the standard SEAI solar PV grant. Eligibility depends on the scheme’s actual household, contractor and technical requirements. Check the Solar Grants guide and SEAI’s official solar electricity grant before work starts.
A reputable installer should give you a roof-specific yield estimate—not merely promise that all houses save the same amount.
Should you choose east, west or south?
- If your only objective is maximum annual generation per installed kWp, an unshaded, suitably tilted south-facing array is the normal benchmark.
- If your south roof is shaded or too small, a clear east/west layout may be the better real-world option.
- If household consumption peaks before or after noon, the generation profile matters alongside the yearly kWh total.
- If you are comparing different installation prices, judge the net installed cost and expected value of the electricity—not just the panel count.
The right next step is a roof-specific estimate and two comparable quotes. Start with the Compound Solar Hub, see How Many Solar Panels Do You Need?, and use our installer quote checklist before you commit.
Method and sources: The irradiation table is reproduced and normalised from Table 8 of the SEAI-hosted Stoneybatter Energy Master Plan. PVGIS methodological descriptions are from the European Commission’s Joint Research Centre. Financial examples are clearly labelled assumptions, not current market price quotes or household savings guarantees. This guide was reviewed 13 October 2026.