Tyson’s Chicken Earned $1.75 Billion. Can It Carry Beef’s $1.22 Billion Loss?
Tyson’s Chicken and Prepared Foods businesses are producing strong profit while Beef loses money. The question is whether diversification can protect cash flow through the cattle shortage.
 Wealth / The Compound journal
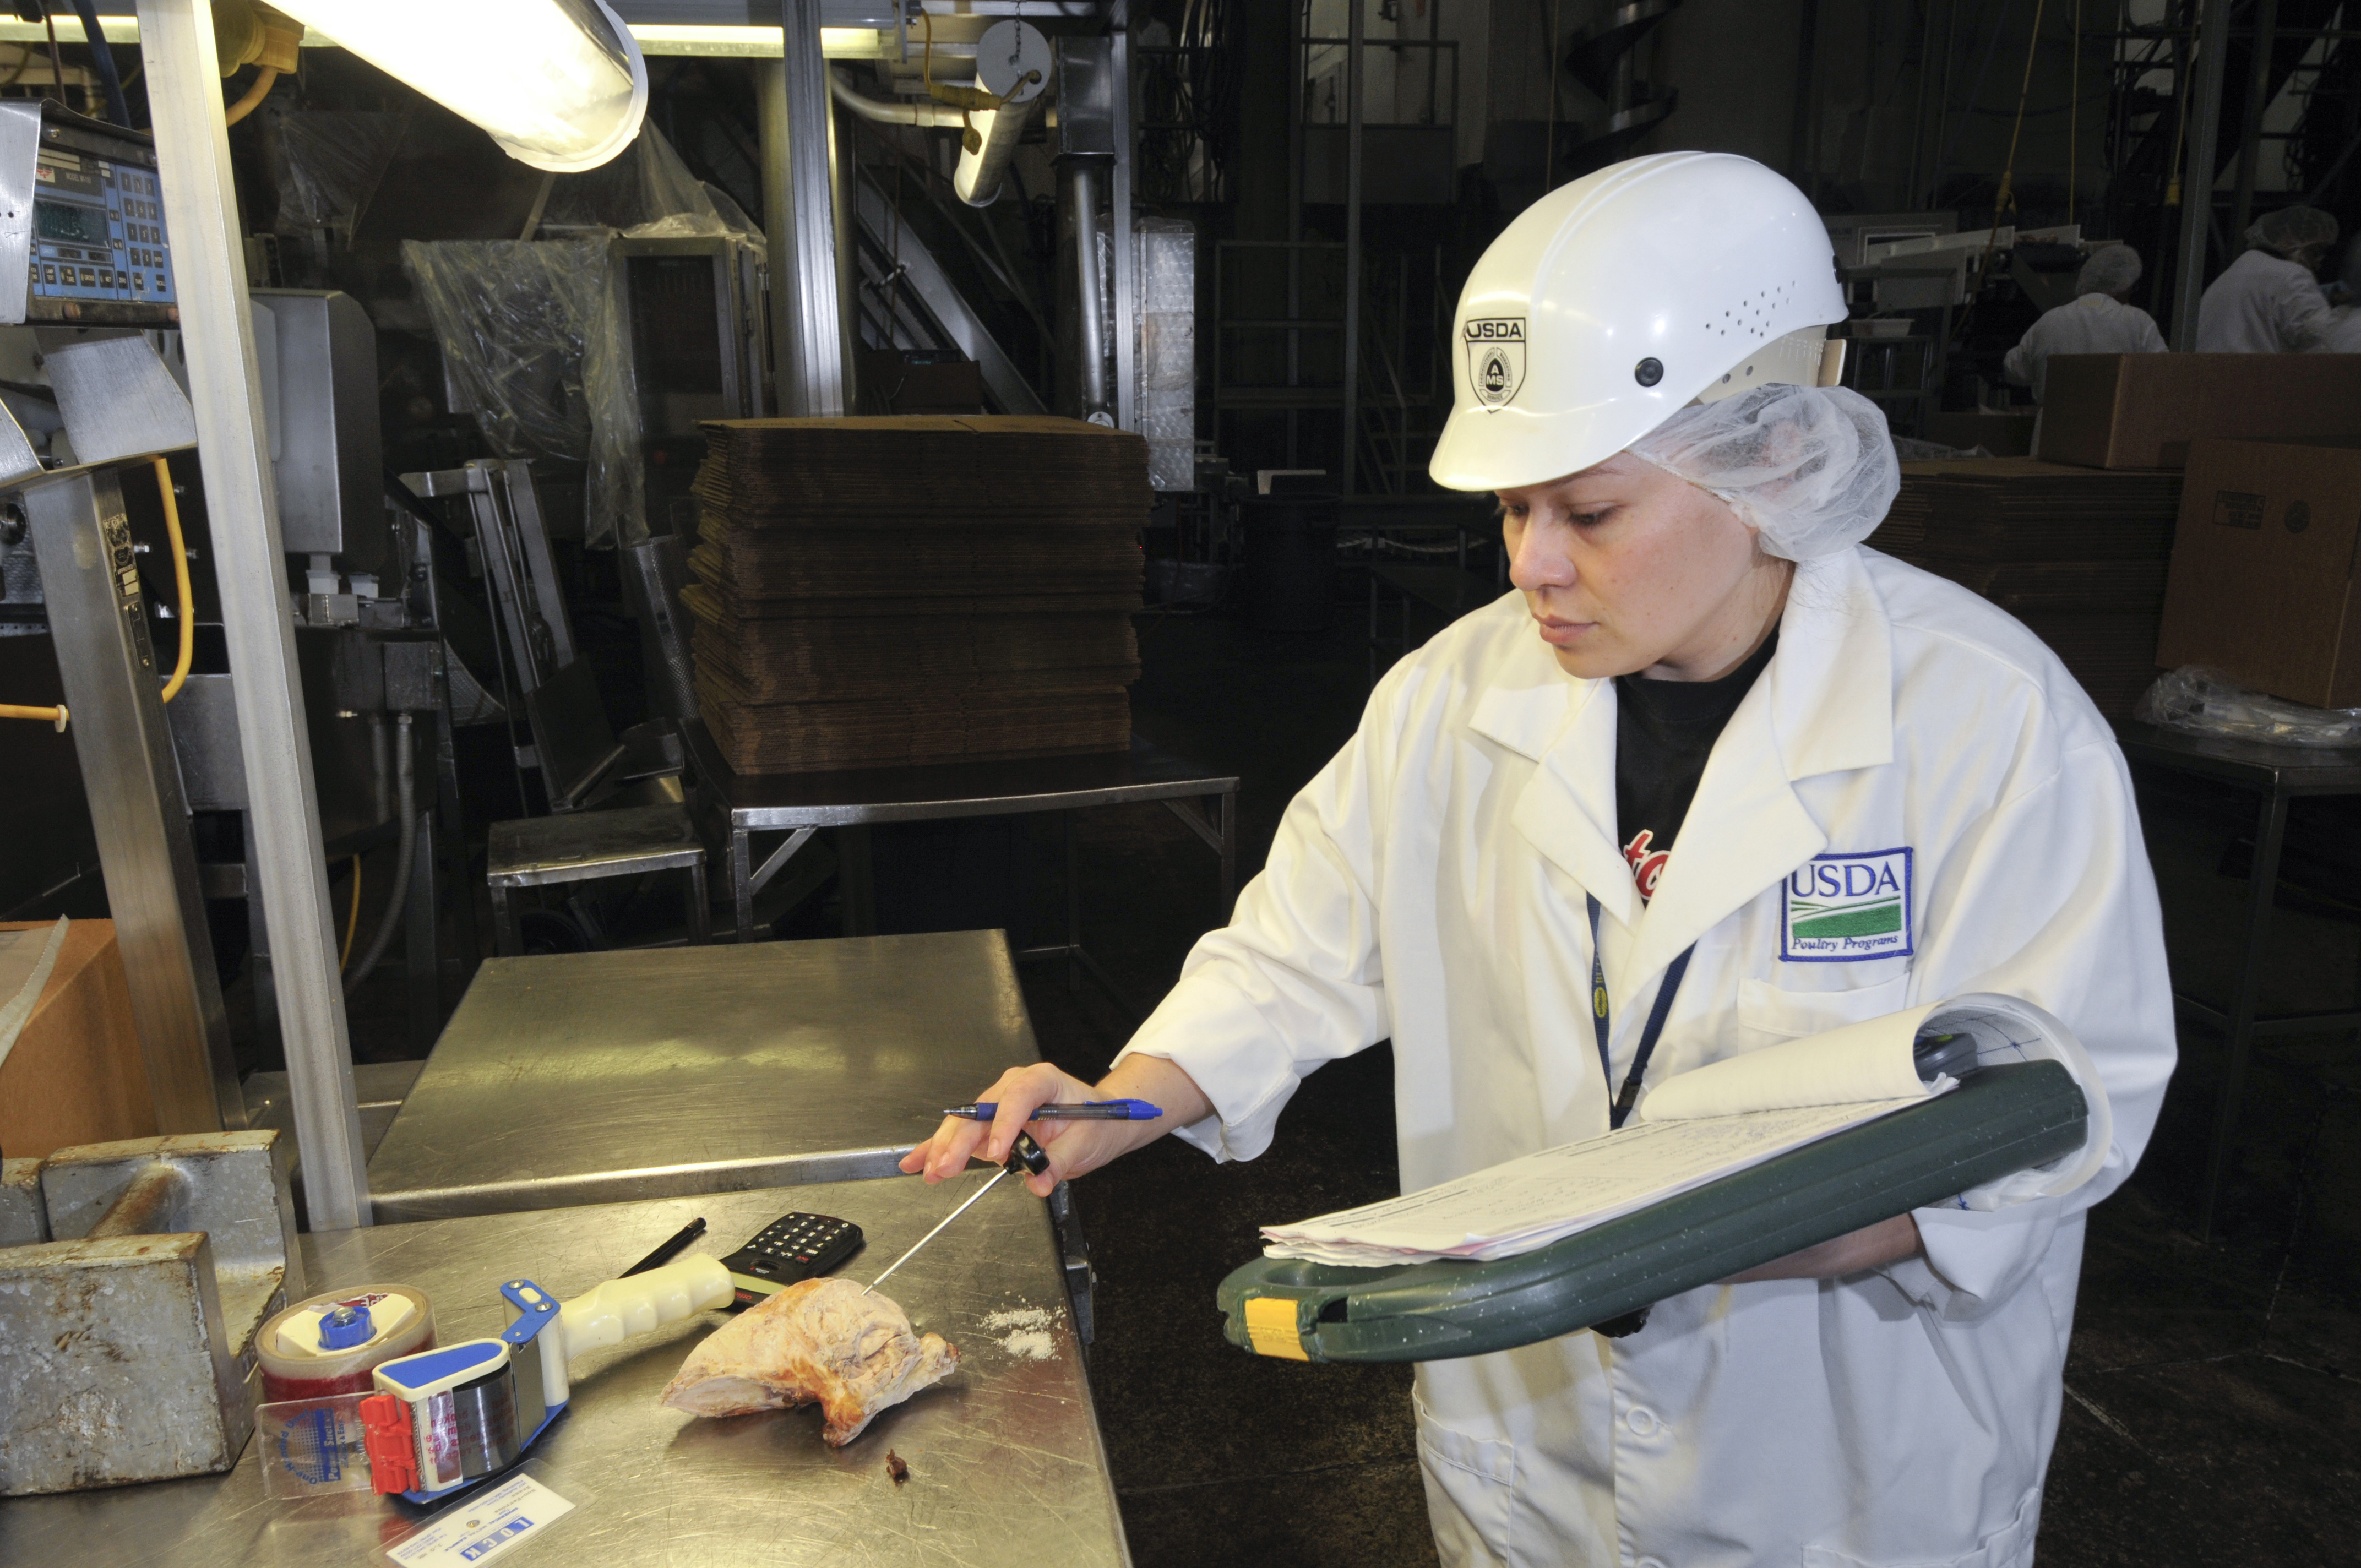
Photo: Bob Nichols / USDA, public domain. Archival photograph captured 25 March 2010 at Tyson Foods’ Berryville, Arkansas poultry plant. · Illustrative image.
Tyson Foods is often discussed as one meat company. Its fiscal 2026 results show why investors need to treat it as several different protein businesses sharing a balance sheet.
Chicken generated $1.75 billion of reported operating income and Prepared Foods generated $1.33 billion. Beef lost $1.22 billion. Pork and International were profitable, but much smaller.
That divergence raises a specific investment question: can Tyson’s stronger businesses protect cash flow until tight cattle supply and plant restructuring improve Beef’s economics?
For the maintained quarterly record, see Tyson Foods’ stock profile. This article focuses on the segment cross-subsidy and what fiscal 2027 guidance implies.
Chicken and prepared food are doing the heavy lifting
Chicken and Prepared Foods produced $3.08 billion of combined reported operating income. The Beef loss absorbed approximately 39.5% of that amount, calculated from the reported segment figures.
The underlying volume and price movements help explain the split. Chicken volume increased 4.1% and average price rose 0.8%. Prepared Foods volume rose 2.0% while average price increased 3.7%. In Beef, volume fell 10.6% even as average price increased 10.2%.
Higher beef prices did not compensate for scarce cattle and lower plant utilisation. When processors compete for fewer animals, the cost of livestock can rise faster than the value of the beef sold. Fixed plant costs then have to be spread across less volume.
Chicken has a different production cycle. Supply can adjust more quickly, and Tyson controls more of the chain. Prepared Foods adds brands and processing, which can reduce direct exposure to the commodity price of a single protein.
Diversification is working, but it is not free. Profit from one segment still funds losses in another.
Reported and adjusted profit tell different stories
Tyson reported $1.10 billion of GAAP operating income for fiscal 2026, compared with $1.98 billion of adjusted operating income. Adjustments included legal, restructuring and other items identified by the company.
Adjusted figures can help isolate ongoing operations, but they should not replace the reported result. Closing and reconfiguring plants consumes cash, and legal costs are real even if management does not expect them to recur in the same form.
The year also contained 53 weeks, so some sales and costs benefited from an extra week. Fiscal 2027 comparisons should not assume that part of growth repeats.
Investors should therefore track both measures: adjusted profit for management’s view of the operating run rate, and GAAP profit for the total economic cost borne in the period.
Cash flow provides a buffer
Tyson generated $2.43 billion of operating cash flow and spent $770 million on capital expenditure. Its non-GAAP free cash flow was therefore $1.66 billion. The company reduced total debt by $1.08 billion during the year.
That cash generation matters because Beef may not recover quickly. Cattle herds take years, not months, to rebuild. A stronger balance sheet gives Tyson time to restructure capacity without depending on a perfectly timed cycle.
For fiscal 2027, management expects free cash flow of $800 million to $1.3 billion and capital expenditure of $1.1 billion to $1.4 billion. The midpoint of the free-cash-flow range is about 37% below fiscal 2026’s result.
The lower outlook is not only a Beef story. Higher investment, working capital and the normal variability of agricultural inputs can all affect cash conversion. It does mean that the margin of safety from cash flow is expected to narrow.
Fiscal 2027 still depends on a wide Beef range
Tyson guides Beef to adjusted operating income between a $300 million loss and a $100 million profit. A $400 million range is unusually important because it spans both sides of break-even.
Management expects Chicken adjusted operating income of $1.3 billion to $1.6 billion and Prepared Foods of $1.25 billion to $1.4 billion. Those ranges remain the centre of the earnings case. At their midpoints, they would contribute $2.78 billion before Pork, International and roughly $1 billion of corporate costs and amortisation.
Total adjusted operating-income guidance is $1.7 billion to $2.15 billion. The breadth of that range reflects how quickly commodity and utilisation economics can move.
Sales are expected to decline 3.5% to 5.5%, primarily because restructuring and tight cattle supply reduce Beef volumes. Lower sales are not automatically a deterioration if Tyson deliberately exits uneconomic throughput. The useful test is whether less volume produces a smaller loss and better cash returns.
What would strengthen the case?
The most constructive result would be Beef moving toward break-even without Chicken and Prepared Foods surrendering their margins. Meeting the free-cash-flow range while funding the larger capital programme would show that operating profit converts into cash.
The case would weaken if cattle costs keep Beef near the bottom of guidance, Chicken margins retreat at the same time, or capital spending rises without better productivity. That combination would expose the limits of diversification precisely when the balance sheet is being asked to absorb more pressure.
Tyson’s stronger segments have bought time, not removed the Beef problem. The investment case depends on management using that time to reduce structurally unprofitable capacity while protecting the cash engines in Chicken and Prepared Foods. A view on the shares also requires a current valuation and explicit assumptions; this analysis makes no price target.
Explore Compound’s earnings hub and our guide to investment diversification.
Reported figures are in US dollars and relate to Tyson Foods’ fiscal 2026 unless stated otherwise. Free cash flow and fiscal 2027 segment guidance are non-GAAP measures. Facts come from Tyson’s results release and 10-K; interpretation and rounded calculations are Compound’s. General information, not personal investment advice.
Cover: Bob Nichols / USDA, Wikimedia Commons, public domain. Captured 25 March 2010 at Tyson Foods’ Berryville, Arkansas poultry plant. Resized for publication; archival image.