Disney Is Spending $9 Billion on Experiences. Can Parks and Cruises Earn the Return?
Disney’s parks and cruises produce most of its segment profit and are absorbing another large investment programme. The question is whether expansion can sustain returns and cash flow.
 Wealth / The Compound journal
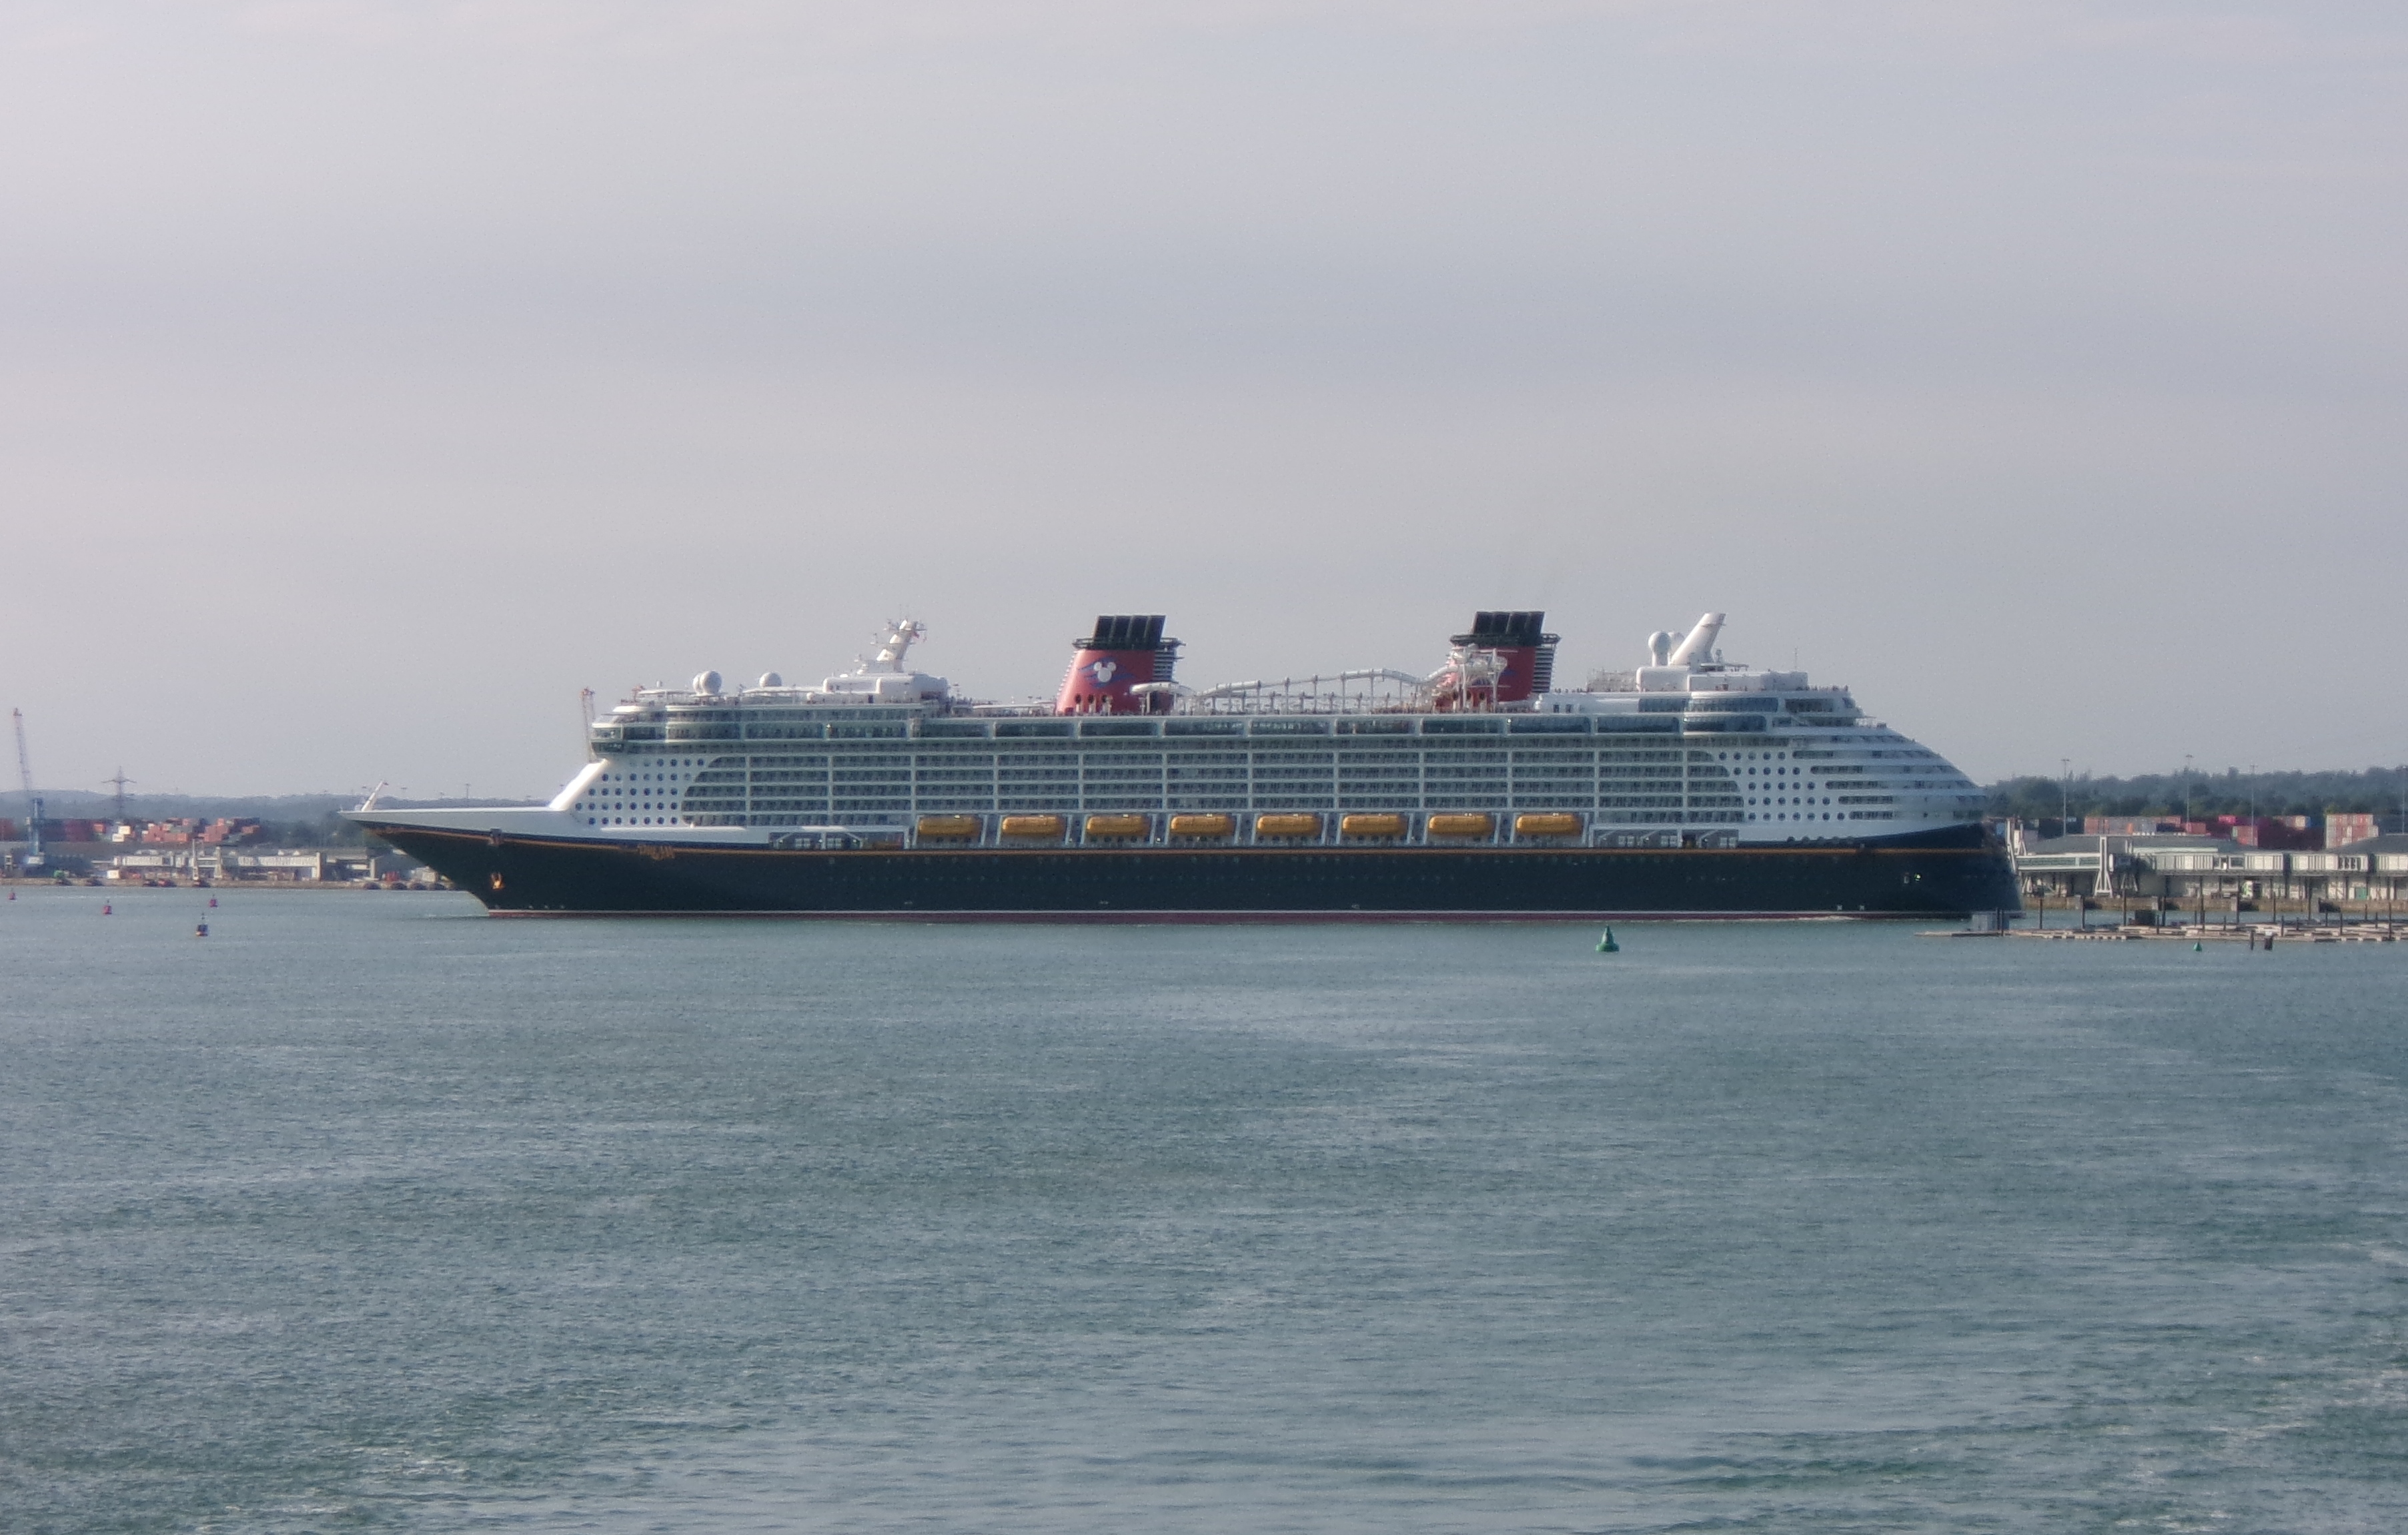
Photo: ITookSomePhotos / Wikimedia Commons, CC BY 4.0. Archival photograph captured 27 August 2024. · Illustrative image.
Disney’s parks, resorts and cruises are no longer just the physical complement to its entertainment brands. They are the company’s largest source of segment profit and the destination for another major investment cycle.
In the 53 weeks ended 3 October 2026, the Experiences segment generated $39.6 billion of revenue and $11.2 billion of segment operating income. Both reached records. Revenue rose 9%, while operating income rose 12%.
Disney now expects roughly $9 billion of capital expenditure in fiscal 2027. The investment case depends on whether new attractions, park capacity and ships can expand the profit pool faster than depreciation and operating costs rise.
For the maintained financial record, see Disney’s stock profile. This article examines the return on the physical expansion.
Experiences is carrying more than half the profit
Disney reported total segment operating income of $19.7 billion, a non-GAAP measure that excludes corporate and certain other items. Experiences supplied approximately 56.7% of that total.
Its segment margin increased to 28.3% from 27.6%, calculated from the reported revenue and operating-income figures. More revealingly, the segment added $1.20 billion of operating income on $3.41 billion of additional revenue. That implies an incremental margin of about 35%.
An incremental margin above the existing margin suggests the current portfolio can absorb more visitors and spending efficiently. It does not guarantee the same result from future projects. A new ship or attraction requires substantial cash before it welcomes a guest, and early operating costs arrive before occupancy and pricing mature.
The segment also benefited from an extra week in fiscal 2026. Comparisons for fiscal 2027 need to separate underlying demand from that calendar advantage.
The investment is already visible in cash flow
Disney generated $19.27 billion of operating cash flow in fiscal 2026. It spent $8.70 billion on parks, resorts and other property, producing $10.57 billion of free cash flow under Disney’s non-GAAP definition.
Capital spending increased from $8.02 billion, mainly because of higher spending on attractions and expansion projects, partly offset by lower cruise-ship spending. For fiscal 2027, management expects about $9 billion of capital expenditure and approximately $11 billion of free cash flow.
That guidance suggests Disney expects cash generation to cover the investment programme. Management also targets roughly $9 billion of share repurchases. But capex and buybacks compete for the same cash after operations. If projects overrun or demand weakens, maintaining both ambitions could require more borrowing or a slower pace of capital returns.
The $9 billion repurchase target should therefore be treated as an allocation plan, not evidence that every dollar of free cash flow is surplus.
Cruises extend the brand and the risk
Disney’s cruise fleet provides a useful example of the economics. The company has four more ships planned from 2027 through 2030 under existing contracts. A ship can add years of capacity and provide multiple ways to monetise the same intellectual property through fares, food, retail and excursions.
It also concentrates capital in a long-lived asset. Demand must remain strong enough to fill cabins at attractive prices, while fuel, labour, maintenance and port costs continue. Unlike a streaming series, a ship cannot be cancelled cheaply after production begins.
The 10-K explicitly warns that large investments are made before Disney knows whether consumers will accept them, and that cost overruns or lower-than-expected returns can occur. That standard risk disclosure is particularly relevant during a multi-year fleet and park expansion.
Depreciation at Experiences increased by $397 million to $3.22 billion, driven by parks, resorts and cruise assets. Higher depreciation is not a cash outflow in the current period, but it records the consumption of assets that required real cash to build.
Parks still depend on discretionary spending
Experiences can appear steadier than film releases because bookings and visits recur. It is not immune to the consumer cycle. A family can delay a holiday, trade down on hotels and food, or choose a closer destination.
Disney expects high-single-digit Experiences operating-income growth in fiscal 2027 after adjusting for the extra week and reporting changes. It also expects reported operating income in the second half to be roughly flat, partly because the comparison includes cruise launches, World of Frozen and tariff refunds in the prior year.
This phasing matters. Investors should test results against management’s stated calendar rather than interpret every slow quarter as a change in the long-term thesis. But repeated explanations for delays would eventually become evidence that the projects are not ramping as expected.
What would prove the spending is productive?
The strongest evidence would be sustained guest spending and occupancy, incremental margins remaining above the segment average, and free cash flow growing after the new assets enter service. A stable or improving return on invested capital would be more important than a single attendance figure.
The case would weaken if operating-income growth lags depreciation for a prolonged period, if free-cash-flow guidance slips while capex remains high, or if discounts are needed to fill new capacity. Higher revenue alone would not be enough if the asset base grows faster than profit.
Disney has a profitable engine worth expanding. The investment question is whether it can preserve the scarcity and pricing power of its Experiences business while adding a large amount of capacity. A view on the shares also requires a current valuation and explicit assumptions; this analysis makes no price target.
Explore Compound’s earnings hub and our guide to investment diversification.
Reported figures are in US dollars and relate to Disney’s fiscal 2026 unless stated otherwise. Segment operating income and free cash flow are non-GAAP measures. Facts come from Disney’s results release and 10-K; interpretation and rounded calculations are Compound’s. General information, not personal investment advice.
Cover: ITookSomePhotos, Wikimedia Commons, under CC BY 4.0. Captured 27 August 2024. Resized for publication; archival photograph of Disney Dream.