BJ’s Comps Rose 13.5%, but Merchandise Margin Fell. Can Membership Growth Carry the Build?
BJ’s is adding members and digital sales while committing about $800 million to clubs and distribution. The question is whether recurring fees and traffic can offset promotion-heavy merchandise economics.
 Wealth / The Compound journal
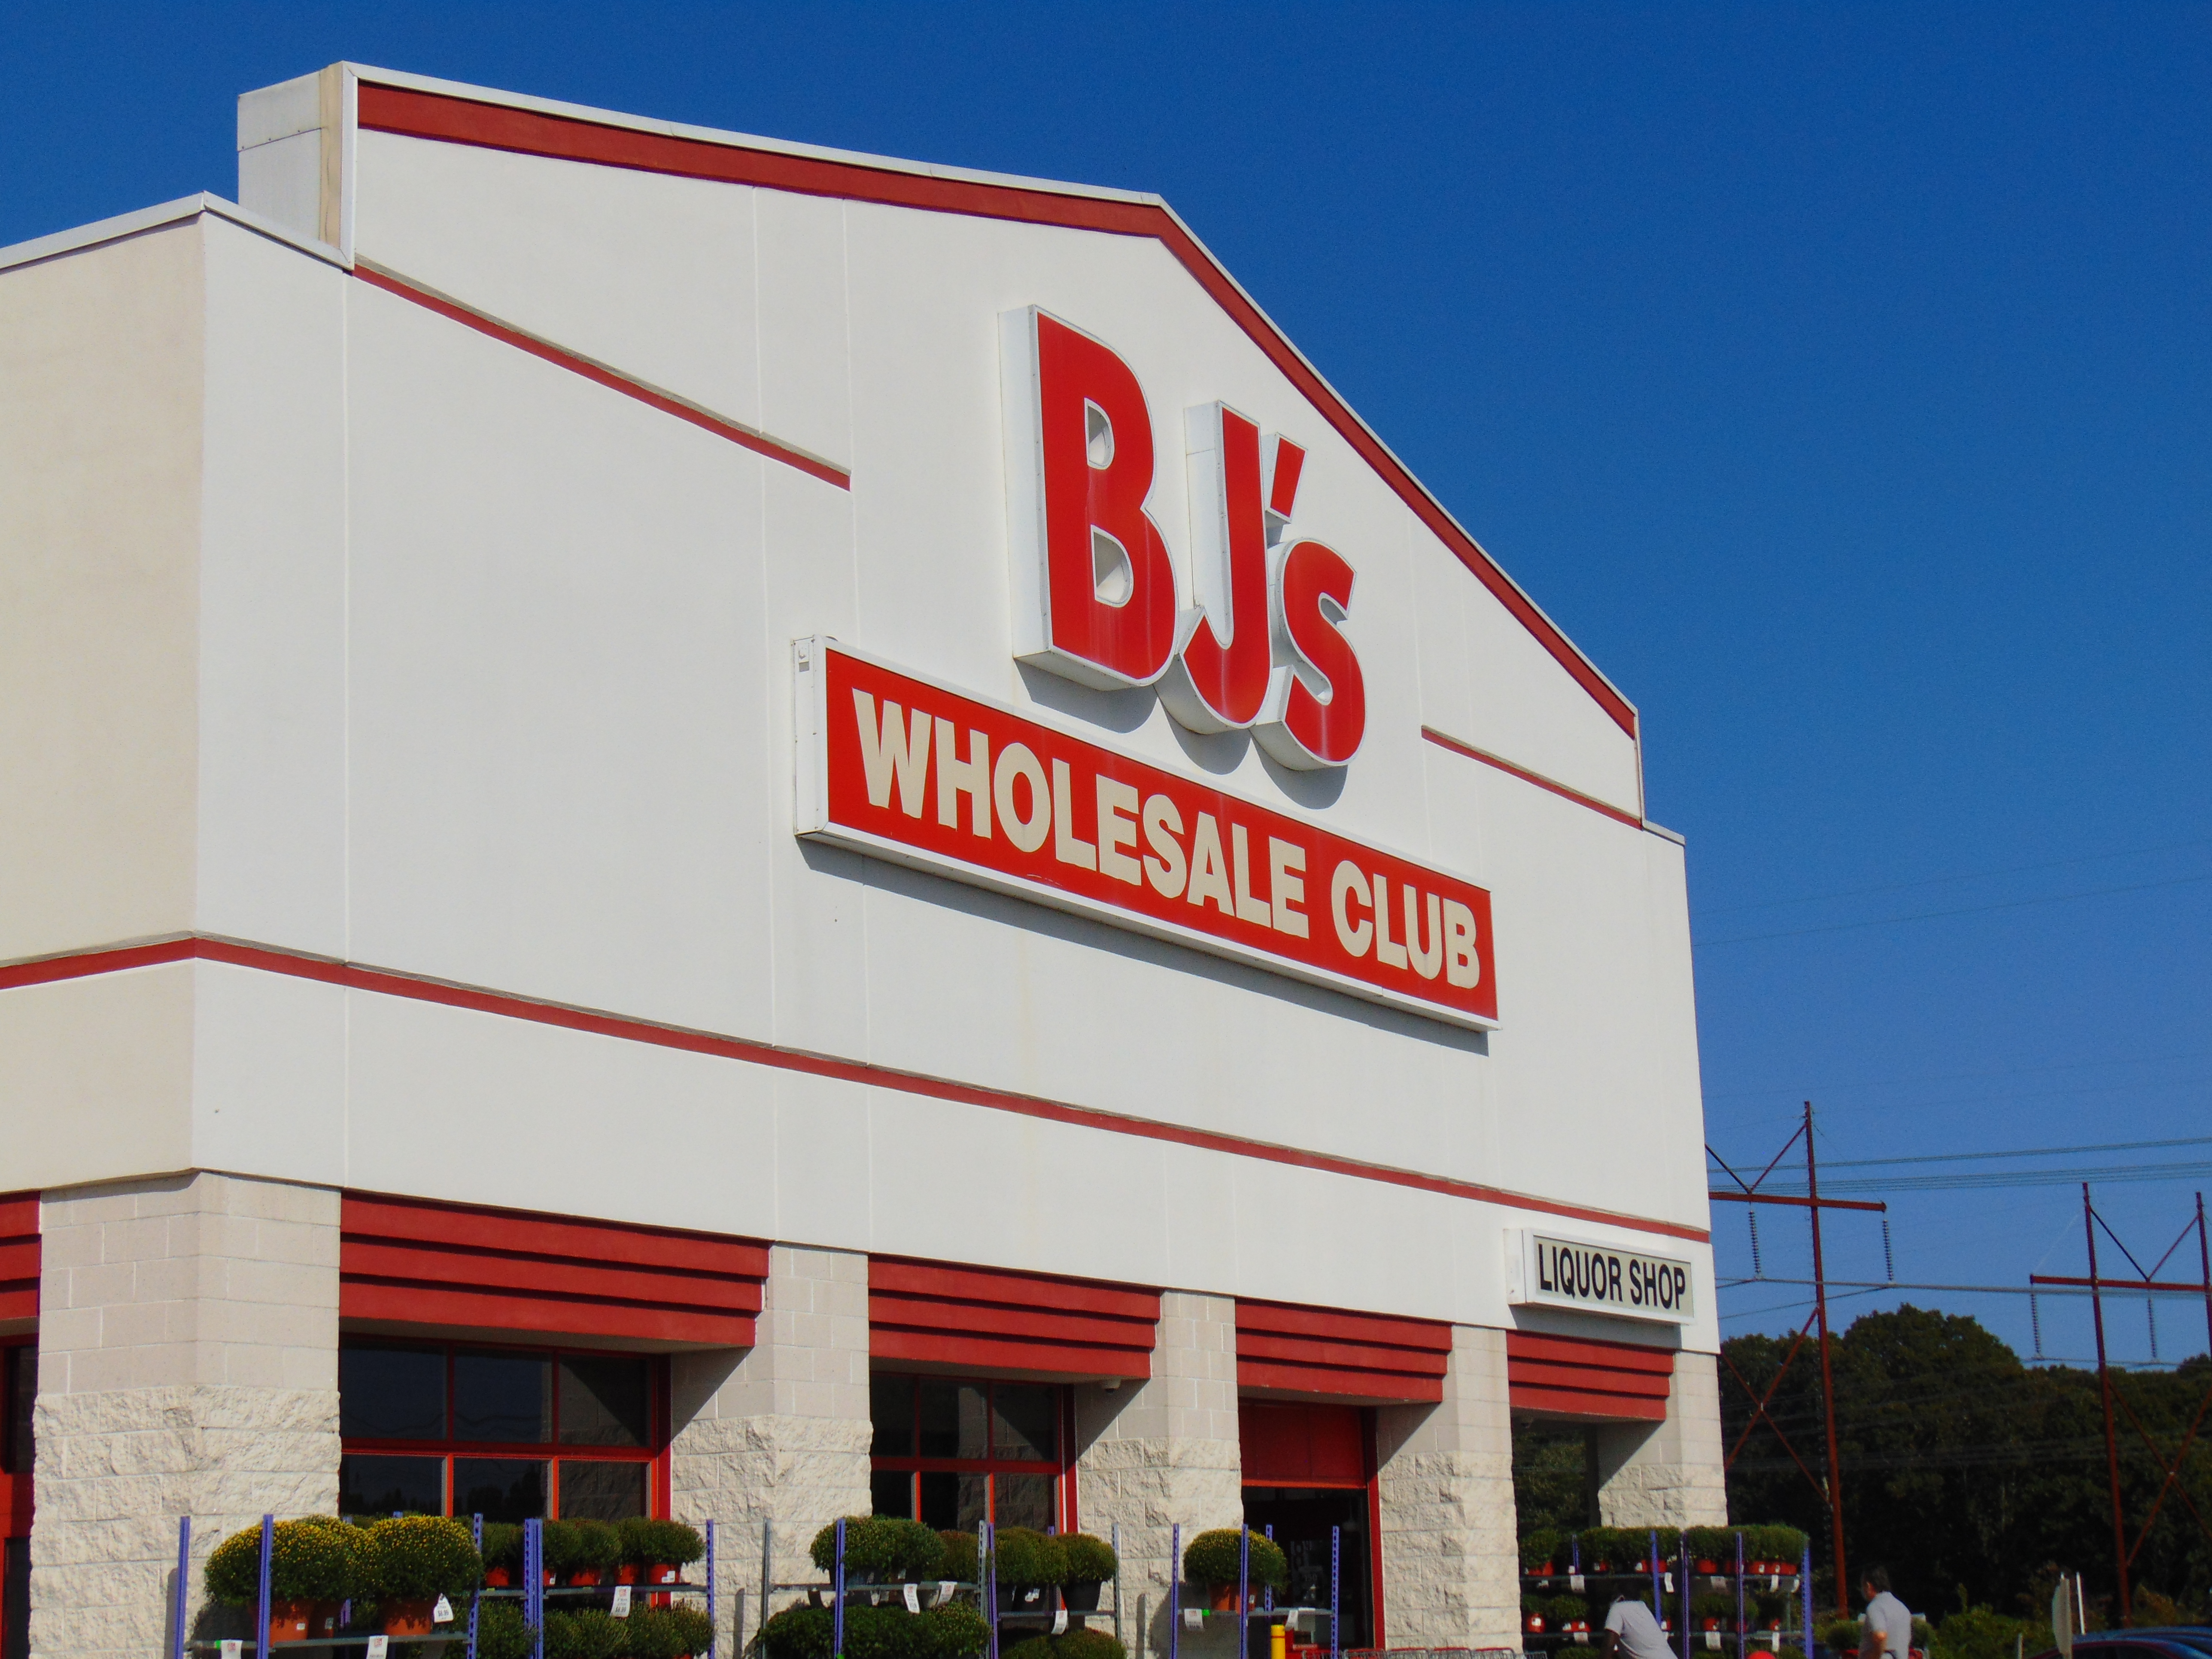
Photo: JJBers / Wikimedia Commons, CC BY 2.0. Archival photograph captured 13 September 2020; cropped and resized for publication. · Illustrative image.
BJ’s Wholesale Club reported a spectacular headline: comparable club sales rose 13.5% in its fiscal third quarter. The underlying economics were more mixed. Gasoline drove much of the comparison, merchandise margin fell and a legal settlement helped reported profit.
For the 13 weeks ended 31 October 2026, comparable sales excluding gasoline increased 4.1%, membership-fee income rose 9.5% to $138.4 million, and digitally enabled comparable sales grew 38%. At the same time, the merchandise gross-margin rate fell about 170 basis points.
That creates a more useful investment question than the quarterly sales beat: can BJ’s convert traffic, memberships and digital adoption into durable cash returns while funding roughly $800 million of annual capital expenditure?
Compound does not currently maintain a dedicated BJ stock profile, so this analysis focuses on the economics rather than repeating a quarterly table.
Gasoline made the headline much larger
Net sales increased 17.7% to $6.15 billion. The 13.5% comparable-sales figure includes gasoline; excluding it, the increase was 4.1%.
Neither measure is wrong, but they answer different questions. Fuel prices and gallons can move total sales sharply without saying much about demand for groceries, household goods or BJ’s private-label range. The ex-gas comparison is a better starting point for the recurring retail relationship.
Management said traffic drove the quarter and that membership acquisition, retention and higher-tier penetration supported fee growth. Membership fees represented only about 2.2% of total revenue, calculated as $138.4 million divided by $6.28 billion. Their economic importance can be greater than their revenue share because BJ’s does not buy inventory to generate the fee.
Digital growth also matters, but “digitally enabled comparable sales” is a channel measure, not a separate profit line. A 38% increase is encouraging if it raises basket size or loyalty. It is less valuable if fulfilment and delivery absorb the incremental gross profit.
Promotions bought traffic at a cost
Gross profit increased only slightly, to $1.02 billion from $1.01 billion, despite the sharp rise in revenue. BJ’s said the merchandise gross-margin rate declined about 170 basis points, primarily because of promotions around its 42nd birthday event.
This may have been a deliberate customer-acquisition investment. Promotions can introduce shoppers to the club, encourage upgrades and produce recurring membership income. The payoff depends on whether those customers renew and spend after the discounts end.
The cleanest confirmation would be continued traffic and fee growth alongside a recovery in merchandise margin. If promotions must remain unusually heavy to sustain comparable sales, the apparent momentum would be less profitable than the headline suggests.
Reported profit needs a settlement adjustment
Operating income rose 43.7% to $313.8 million, while diluted earnings per share increased 50% to $1.73. Those figures should not be read as a pure operating-margin improvement.
Selling, general and administrative expense included a $240 million benefit, net of legal fees, from settling credit-card interchange litigation in which BJ’s was a plaintiff. The company also recognised about $95 million of expenses related to its use of the proceeds, partially offsetting that benefit. Sale-and-leaseback gains also helped SG&A.
The company’s adjusted EPS happened to equal GAAP EPS for the quarter, but that does not make every item economically recurring. Investors should separate the core membership, merchandising and club-opening performance from settlement cash and property transactions.
The expansion programme is consuming real cash
For the first 39 weeks, operating cash flow was $933.2 million, up from $639.1 million. Additions to property and equipment, net of disposals, were $591.5 million. On that simple basis, capital spending absorbed about 63% of operating cash flow.
BJ’s reported adjusted free cash flow of $455.3 million, but its reconciliation also includes sale-and-leaseback proceeds and transactions involving a distribution-centre purchase option. The measure is useful when read with the bridge, not as a substitute for it.
The company expects approximately $800 million of fiscal-year capital expenditure for new clubs and distribution-network improvements. Those assets could increase purchasing scale, shorten fulfilment routes and support membership growth. They also add fixed costs before the new locations mature.
BJ’s bought back $385.5 million of shares during the first nine months. Diluted weighted-average shares fell about 3.3% for the nine-month period and 3.9% in the quarter. Buybacks can improve per-share results, but expansion returns should come first if new clubs genuinely earn more than the company’s cost of capital.
What would confirm the thesis?
The constructive case needs four things: ex-gas comparable sales remaining positive, membership-fee growth staying ahead of core sales, merchandise margin recovering after the promotional event, and operating cash flow growing after the distribution build.
The case would weaken if total comps rely on gasoline, digital sales grow without evidence of operating leverage, or capex remains elevated while free cash flow depends on asset-sale proceeds. A slowdown in renewals or higher-tier penetration would be especially important because recurring fees help support the warehouse-club model.
BJ’s is attracting traffic and members, but the quarter does not prove that the new volume is becoming more profitable. The next test is whether recurring fees and distribution investment can produce stronger merchandise economics after promotions normalise. A view on the shares also requires a current valuation and explicit assumptions; this analysis makes no price target.
Explore Compound’s earnings hub and our guide to investment diversification.
Reported figures are in US dollars and relate to BJ’s fiscal 2026 third quarter or first 39 weeks ended 31 October 2026, as stated. Comparable sales and adjusted free cash flow are company-defined non-GAAP measures. Facts come from the company’s SEC-furnished results release and Forms 8-K; interpretation and rounded calculations are Compound’s. General information, not personal investment advice.
Cover: JJBers, Wikimedia Commons, under CC BY 2.0. Captured 13 September 2020 in Waterford, Connecticut. Cropped and resized for publication; archival image.