Nvidia Q3 Earnings: $115.8bn Sales, but Lower Q4 Margins Ahead
Nvidia's Q3 FY2027 revenue hit $115.8 billion and GAAP net income reached $65.3 billion. The bigger question is the slide in fourth-quarter margin guidance.
 News / Wealth
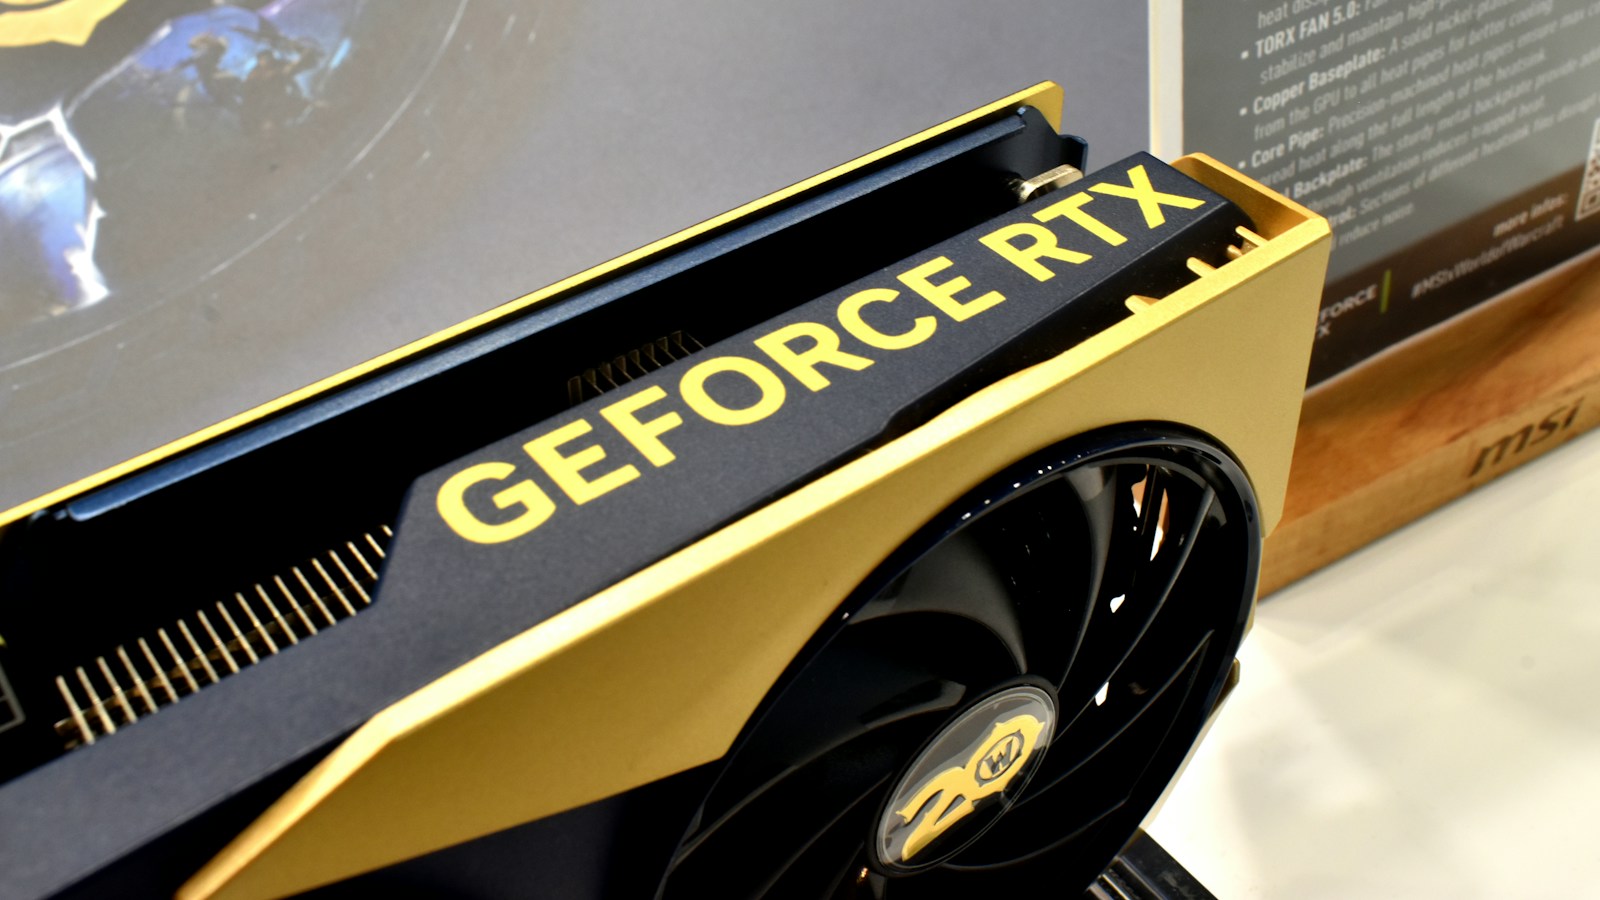
Photo: Gavin Phillips / Unsplash; published 20 October 2025; Unsplash License (archival consumer graphics card). · Illustrative image.
Nvidia reported $115.844 billion in revenue for its fiscal third quarter, 103% above the same period last year. But the figure with the greatest implications for future profit may be its forecast for gross margin to fall from 74.8% to 71–72% next quarter.
The results released on 17 November 2026 cover the three months ended 25 October 2026, part of Nvidia’s fiscal year 2027. They are actual reported results, not forecasts for calendar 2027. This analysis uses Nvidia’s official earnings announcement and unaudited financial statements; the separate current-quarter SEC earnings filing was not yet accessible when this analysis was prepared, so no unverified 8-K accession is claimed.
Nvidia Q3 FY2027 earnings: the numbers
| Metric | Q3 FY2027 | Q2 FY2027 | Q3 FY2026 |
|---|---|---|---|
| Revenue, GAAP | $115.844bn | $96.221bn | $57.006bn |
| Gross profit, GAAP | $86.676bn | — | $41.849bn |
| Gross margin, GAAP | 74.8% | 75.0% | 73.4% |
| Operating income, GAAP | $77.520bn | $63.734bn | $36.010bn |
| Net income, GAAP | $65.287bn | $59.688bn | $31.910bn |
| Diluted EPS, GAAP | $2.70 | $2.46 | $1.30 |
| Diluted EPS, non-GAAP | $2.68 | $2.22 | $1.27 |
Source: Nvidia’s 17 November 2026 results announcement, including the comparative tables. Dollars in US billions except per-share figures. GAAP and non-GAAP measures are deliberately not mixed.
The rounded headline conceals a striking scale effect. Quarterly revenue added $19.623 billion from Q2; quarterly net profit added $5.599 billion. Revenue growth was about 20.4% sequentially and 103.2% annually, while net profit rose about 9.4% sequentially. Operating income increased approximately 21.6% from Q2.
Nvidia had previously guided to $108 billion of Q3 revenue, plus or minus 2%. Actual revenue beat that midpoint by $7.844 billion, approximately 7.3%. That comparison is with the company’s own guidance, not a claim about a Wall Street analyst consensus.
Data Center accounted for nearly 93% of sales
Nvidia separately reported $107.6 billion in Data Center revenue, up 21% from the prior quarter and 110% year on year. On rounded segment figures, Data Center represented approximately 92.9% of group sales; Edge Computing supplied the remaining $8.2 billion, growing 14% sequentially and 42% annually.
That concentration matters more than the headline that AI demand is expanding. Nvidia’s investment case rests on sustained purchases of complete accelerated-computing systems by customers building infrastructure at extraordinary scale. The company says its Vera Rubin NVL72 platform has begun shipping. That is a commercial milestone, but investors should distinguish equipment shipped to customers from the economic returns those customers will ultimately earn on their deployments.
A large share of revenue coming from one reporting segment is not the same as reliance on a single buyer. Nevertheless, it means changes in infrastructure budgets, shipping schedules or product pricing can have an outsized influence on Nvidia’s results.
The real financial question: what happens to gross profit next quarter?
For Q4 FY2027, Nvidia guided revenue to $130 billion, plus or minus 3%, a range of $126.1 billion to $133.9 billion. That quarter contains an extra reporting week, so its implied revenue growth is not a clean like-for-like quarterly run rate. The company is also excluding Data Center compute revenue from China from this outlook.
More revealingly, Nvidia forecasts 71–72% gross margin, down from 74.8% GAAP margin in Q3. The arithmetic shows why a few percentage points matter when revenue is so high.
| Scenario | Illustrative gross profit |
|---|---|
| Q3 actual: $115.844bn sales × actual gross margin (unrounded) | $86.676bn |
| Q4 midpoint sales $130bn × guided 71% margin | $92.30bn |
| Q4 midpoint sales $130bn × guided 72% margin | $93.60bn |
| Q4 midpoint sales $130bn × hypothetical unchanged 74.8% margin | $97.24bn |
Q4 calculations are simple scenarios using the revenue midpoint and indicated margin assumptions, not realised results or company gross-profit guidance. The 74.8% comparison is hypothetical. Figures are rounded.
At the $130 billion revenue midpoint, the difference between a 71% and 74.8% gross margin is about $4.94 billion of quarterly gross profit. Growth may still lift total gross profit in dollar terms, even as the percentage retained from sales falls. Investors should therefore avoid calling a lower margin an automatic earnings collapse, just as they should avoid overlooking the direction of margin pressure.
Nvidia also guided approximately $11.0 billion of Q4 GAAP operating expenses, compared with $9.156 billion in Q3. This gives another reason not to equate gross profit directly with earnings per share. Read Nvidia’s gross-margin sensitivity analysis for the economic mechanism.
Nvidia’s $43.78bn free cash flow is powerful — with important caveats
The quarter generated $48.253 billion of cash from operations. Nvidia defines its non-GAAP free cash flow as operating cash flow less purchases of property, equipment and intangible assets, and less principal payments on those assets. With $4.422 billion of purchases and $54 million of principal payments, this equals approximately $43.777 billion in free cash flow, as reported by the company.
That is a substantial cash generation figure, not just an accounting profit number. But the reported cash flow should be read alongside growing receivables, inventories and supply-chain commitments. The quarter’s cash-flow statement shows accounts receivable absorbing $18.052 billion and inventories absorbing $8.148 billion of cash. Rapid sales growth can increase those working-capital requirements.
Nvidia said it returned $28.1 billion through buybacks and cash dividends during the quarter and had $227.3 billion of share-repurchase authorisation remaining at quarter-end. An authorisation is permission, not a legally required future cash distribution.
Why GAAP EPS exceeded adjusted EPS
One unusual detail is that GAAP EPS of $2.70 exceeds non-GAAP EPS of $2.68. That is not necessarily a contradiction. Nvidia’s reconciliation excludes specified gains and losses on equity securities, along with other adjustments and tax effects, from its non-GAAP presentation. Because these adjustments can work in both directions, adjusted earnings are not automatically higher than reported earnings. Neither number should be substituted for the other when comparing quarters or valuation multiples.
What Nvidia shareholders should monitor
The immediate operating test is whether the company can deliver the announced growth while protecting attractive gross-profit dollars through the Vera Rubin ramp. Beyond the next revenue number, the useful indicators are Data Center growth, the guided margin reset, cash conversion after working-capital demands, operating expenses, and customers’ ability to earn a return on accelerated-computing investment.
Export controls and Nvidia’s decision to exclude China Data Center compute sales from its outlook remain relevant. So do supply-chain capacity and the changing mix of products sold. The Q4 extra week makes simple quarter-to-quarter annualisation especially unreliable.
For the continuous fiscal-quarter history and live chart, use the Nvidia (NVDA) earnings and stock page. See also Compound’s earnings archive and Nvidia stock research: software, margins and valuation.
Sources and method
- Nvidia Q3 FY2027 results release, including statements of income, cash flow and outlook, 17 November 2026.
- Nvidia Q2 FY2027 10-Q on the SEC, for the previous fiscal quarter’s regulated filing.
- Nvidia Q2 earnings release filed as SEC exhibit, for the prior guidance comparison.
Photo: real NVIDIA consumer graphics card photographed by Gavin Phillips; published on Unsplash in October 2025, used as an archival brand illustration, not a photograph of a 2026 Vera Rubin data-centre rack. Original and licence.
Figures are Nvidia-reported unless expressly described as calculations or scenarios; rounded inputs can produce small differences. General information and investment research, not personalised financial advice.