UPS Is Delivering Fewer US Packages. Can Price and Automation Do the Rest?
UPS is earning more revenue per US package while handling fewer of them. The investment test is whether pricing and network savings can outrun rising unit costs.
 Wealth / The Compound journal
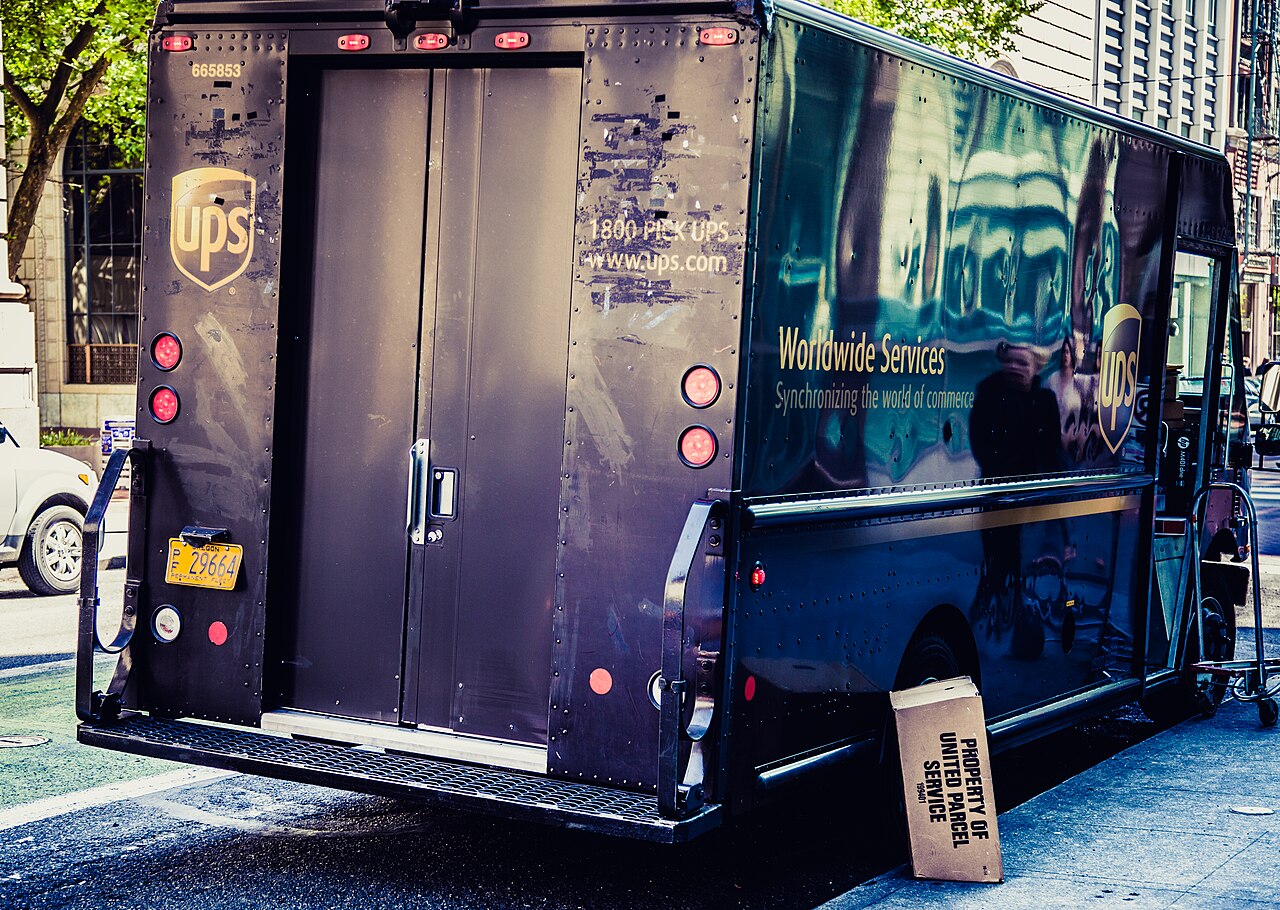
Photo: Tony Webster / Wikimedia Commons, CC BY 2.0. Archival photograph, 14 May 2015; resized for publication. · Illustrative image.
UPS is testing whether a parcel network can become more profitable while carrying fewer domestic packages. Higher prices and better mix are helping revenue. Automation and network cuts are meant to lower the cost of serving that demand.
For Q3 2026, average daily US package volume fell to 15.6 million, down about 3.3% from 16.2 million a year earlier. Yet US Domestic revenue increased 4.5% to $14.9 billion because revenue per piece rose 6.1%.
That combination looks attractive, but it is incomplete. UPS’s adjusted cost per piece increased 5.5%. The investment question is whether pricing and productivity can keep improving faster than the underlying cost of the network.
For the maintained financial record, see UPS’s stock profile. This article focuses on the economics behind the latest quarter.
Fewer parcels do not automatically mean lower profit
Parcel networks carry large fixed costs. Sorting hubs, aircraft, vehicles and technology do not disappear when daily volume falls. Losing low-return packages can still improve the business if UPS can remove the associated capacity or replace those shipments with more profitable work.
UPS completed the planned reduction in volume from its largest customer during Q2. Its Q3 release does not identify that customer, so the analysis should not assume a name. Management described premium growth and network efficiency as the drivers of the quarter.
The domestic segment provides evidence on both sides. GAAP operating profit rose to $906 million from $603 million, while its margin improved to 6.1% from 4.2%. Adjusted operating profit increased to $1.03 billion from $905 million, and adjusted margin rose to 7.0% from 6.4%.
Those are genuine improvements. They occurred while domestic adjusted cost per piece also rose to $13.32 from $12.63. Better revenue per piece is currently doing much of the work.
Automation has to change the cost curve
UPS said its network and efficiency initiatives produced about $1.8 billion of benefits in the first nine months of 2026. It expects nearly $3 billion for the full year. The programme is not free: the company recorded $1.4 billion of 2026 programme costs through Q3 and $1.9 billion cumulatively.
Its latest available 10-Q, covering the June quarter, said roughly 80% of planned capital spending was directed to network improvements, technology and capacity initiatives. Vehicle spending was lower because of volume trends, while spending on buildings and facilities increased for network efficiency.
The distinction between a saving and a lasting productivity gain matters. Closing facilities and reducing labour can deliver an immediate benefit. A durable improvement should also lower the cost of handling the next parcel, preserve service quality and leave enough capacity for profitable growth.
I would therefore compare benefits with the programme’s costs, and then watch cost per piece after the restructuring charges fade. If cost per piece keeps rising almost as quickly as revenue per piece, the margin opportunity is narrower than the headline savings imply.
Cash conversion is the strongest part of the quarter
UPS generated $5.99 billion of operating cash flow in the first nine months, up from $5.15 billion. Capital expenditure fell to $2.22 billion from $2.97 billion. Using the company’s definition, which also includes proceeds from property, plant and equipment disposals and other investing items, adjusted free cash flow rose to $4.22 billion from $2.74 billion.
Management raised its full-year adjusted free-cash-flow target to about $6.1 billion. It also expects approximately $3 billion of capital spending, $5.4 billion of dividends and $1.3 billion of pension contributions.
This is useful cash generation, but the allocation arithmetic is demanding. The dividend expectation alone would consume most of the free-cash-flow target. That leaves less flexibility for debt reduction, acquisitions or absorbing a weaker pricing environment. Investors should distinguish cash produced by the network from cash retained after shareholder distributions and other commitments.
International strength complicates the domestic story
UPS is more than its US parcel business. International revenue increased 7.1% to $5.0 billion and operating margin reached 14.9%. Revenue per piece rose 15%. Supply Chain Solutions revenue grew 18.2% to $3.0 billion, including growth in forwarding, logistics and healthcare.
Those businesses diversify the earnings base. They also introduce their own complications. Supply Chain Solutions recorded a $182 million goodwill impairment, which helped reduce its GAAP operating margin to 3.1%; adjusted margin was 9.2%. The difference is a reminder to keep GAAP and adjusted performance separate.
At group level, adjusted operating profit actually fell to $2.05 billion from $2.13 billion, and adjusted margin declined to 9.0% from 10.0%, despite the revenue growth. The domestic improvement has not yet translated into uniformly stronger consolidated economics.
What would make the strategy convincing?
The clearest confirmation would be domestic margin expansion accompanied by slower cost-per-piece growth. Stable service levels after facility changes would support the automation case. Free cash flow should remain strong after capital spending normalises, not only because investment was reduced for a year.
The risk is that pricing becomes harder while volume remains weak and the network still carries too much fixed cost. In that scenario, savings could be offset by wage, maintenance and transport expenses.
UPS has shown that it can make more revenue from fewer US packages. It still has to prove that productivity, rather than price alone, can widen the margin. A valuation conclusion additionally requires a current share price and explicit assumptions; this analysis makes no price target.
Explore Compound’s earnings hub and our guide to investment diversification.
Reported figures are in US dollars. Q3 figures cover the three months ended 30 September 2026; the cited 10-Q covers the six months ended 30 June 2026. Facts come from UPS’s SEC-furnished release and filing; management explanations are attributed and interpretation is Compound’s. General information, not personal investment advice.
Cover: Tony Webster, Wikimedia Commons, under CC BY 2.0. Photographed 14 May 2015 in Portland, Oregon; archival. Resized for publication; display cropping may apply.