Where did Tesla’s gross-profit growth come from? Start with services
Used cars, paid charging and repairs share a line in Tesla’s accounts. That line contributed $368 million of the company’s $440 million year-on-year increase in third-quarter gross profit.
 Wealth / The Compound journal
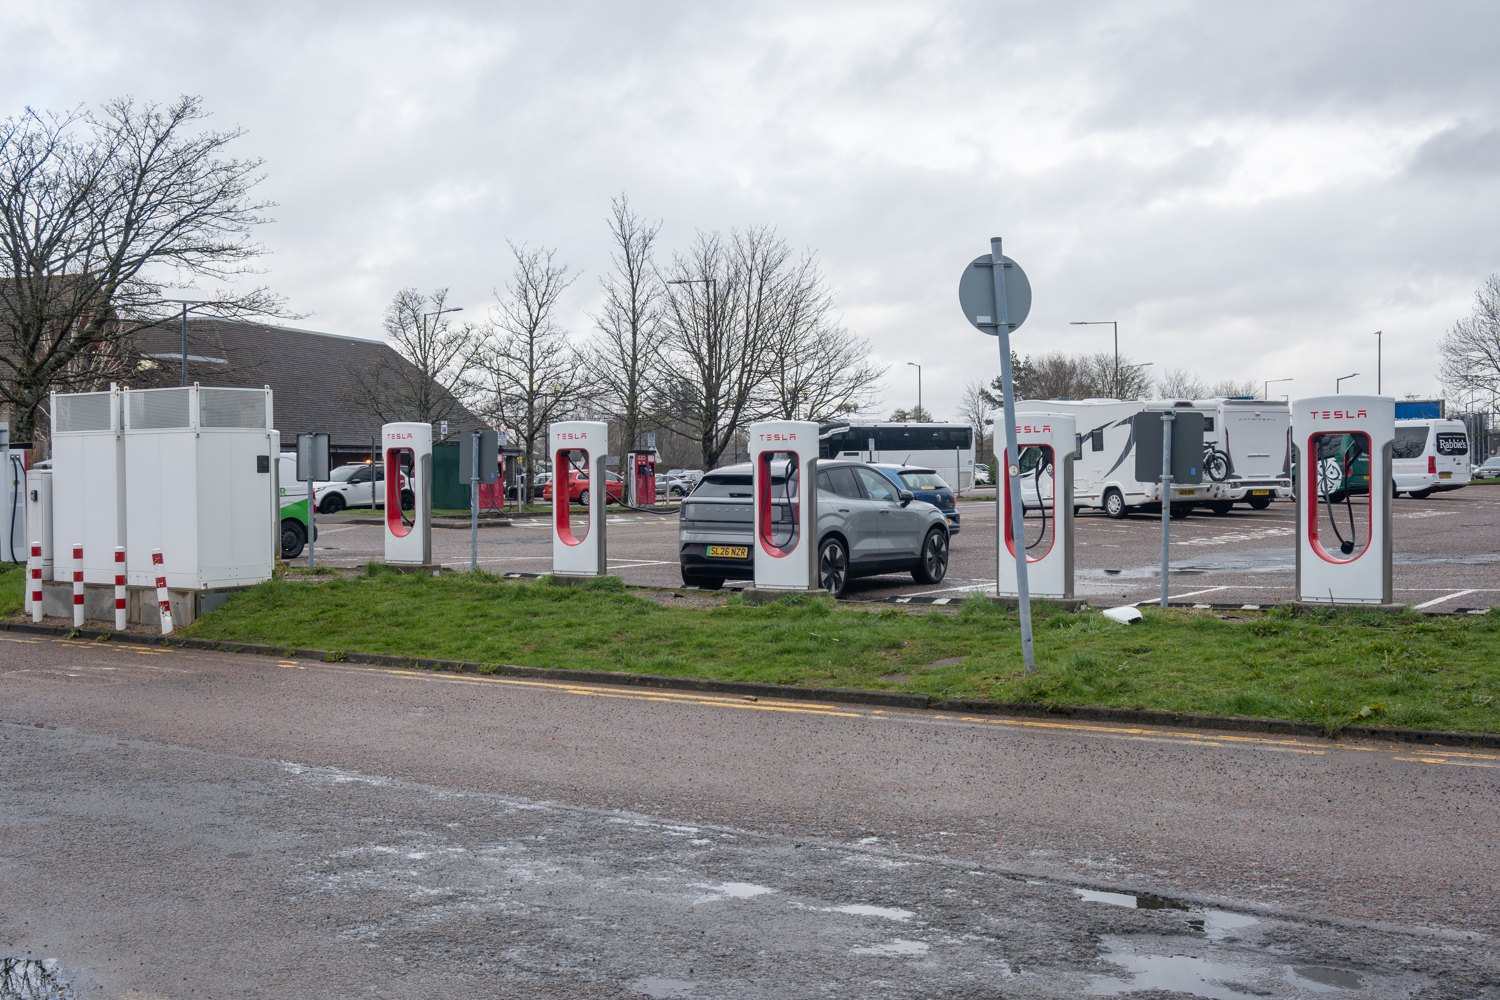
Photo: Lucas Kendall via Wikimedia Commons, CC BY-SA 4.0. Archival photograph taken on 18 April 2026. Resized and cropped. · Illustrative image.
A driver pays to charge a car, another brings one in for a collision repair, and a third buys a used Tesla. Those transactions all feed the same line in Tesla’s accounts. In the three months ended 30 September 2026, “services and other” generated $734 million of gross profit, up from $366 million a year earlier. The $368 million increase accounted for about 84% of the $440 million increase in Tesla’s total gross profit. What can shareholders reasonably attribute to the business Tesla does after a new vehicle leaves the showroom? Tesla’s September 2026 filing · September 2025 filing
How services accounted for most of the increase
Tesla gives shareholders the revenue and cost of revenue for services and other. Subtracting one from the other gives the gross profit. The same figure can be checked a second way by taking automotive gross profit out of the combined automotive and services segment.
| Gross profit, US$ millions | Q3 2025 | Q3 2026 | Change |
|---|---|---|---|
| Automotive, including leasing and regulatory credits | 3,615 | 3,806 | +191 |
| Services and other | 366 | 734 | +368 |
| Energy generation and storage | 1,073 | 954 | −119 |
| Tesla total | 5,054 | 5,494 | +440 |
The distinction between growth and size matters here. Services and other produced about 13% of total gross profit in the latest quarter. Its share of the year-on-year increase was much larger because automotive gross profit rose by $191 million while energy gross profit fell by $119 million. Together those two businesses contributed only $72 million of the increase. These figures measure profit before operating expenses. Tesla’s cost of revenues and gross margin tables
What changed inside the services line?
Services and other revenue rose from $3.475 billion to $4.605 billion year on year. Its cost rose more slowly, from $3.109 billion to $3.871 billion. That took gross profit per $100 of sales from $10.53 to $15.94. The preceding June quarter offers a second comparison. It generated $648 million on $4.581 billion of sales, or $14.15 per $100. From June to September, revenue increased by just $24 million while cost fell by $62 million. That explains the $86 million sequential rise in gross profit even with little movement in sales. September filing · June filing
Tesla attributes the year-on-year revenue gain mainly to selling more used vehicles at higher average prices, higher non-warranty maintenance and collision revenue, and more paid Supercharging sessions. These activities have different economics. Reselling a used car brings its purchase cost into the calculation. For a charger already installed, an additional paid session can spread the cost of the site across more electricity sold. Either activity can lift revenue, and the mix can change the reported margin. Tesla gives no separate gross-profit figure for either activity in these filings. Assigning the full $368 million increase to charging would therefore overstate what shareholders know. Tesla’s explanation of revenue drivers
What would make the improvement durable?
In the next filing, compare the services gross profit per $100 of sales with September’s $15.94, then read the explanation of used-car volumes and prices alongside charging and repairs. If used-car prices soften and the margin still holds, the result would strengthen the case that other activities can sustain the improvement. A falling margin alongside rising revenue would give shareholders a reason to revisit how much profit to expect from each additional dollar of sales. Until Tesla discloses the individual margins, the combined line is the figure an investor can track with confidence.
For the rest of the business, see the Tesla stock profile, the Tesla energy-storage margin analysis and the company earnings hub.
Archival photograph of Tesla Superchargers in Fort William, Scotland, taken by Lucas Kendall on 18 April 2026. The resized image and its crops are available under the same licence. Original photograph · CC BY-SA 4.0