Honeywell Raises Guidance: What the Headline Growth Number Misses
Honeywell reported just 1% sales growth but 7% organic growth. Its SEC results explain the gap, the higher guidance and why adjusted cash flow needs a closer look.
 Wealth / The Compound journal
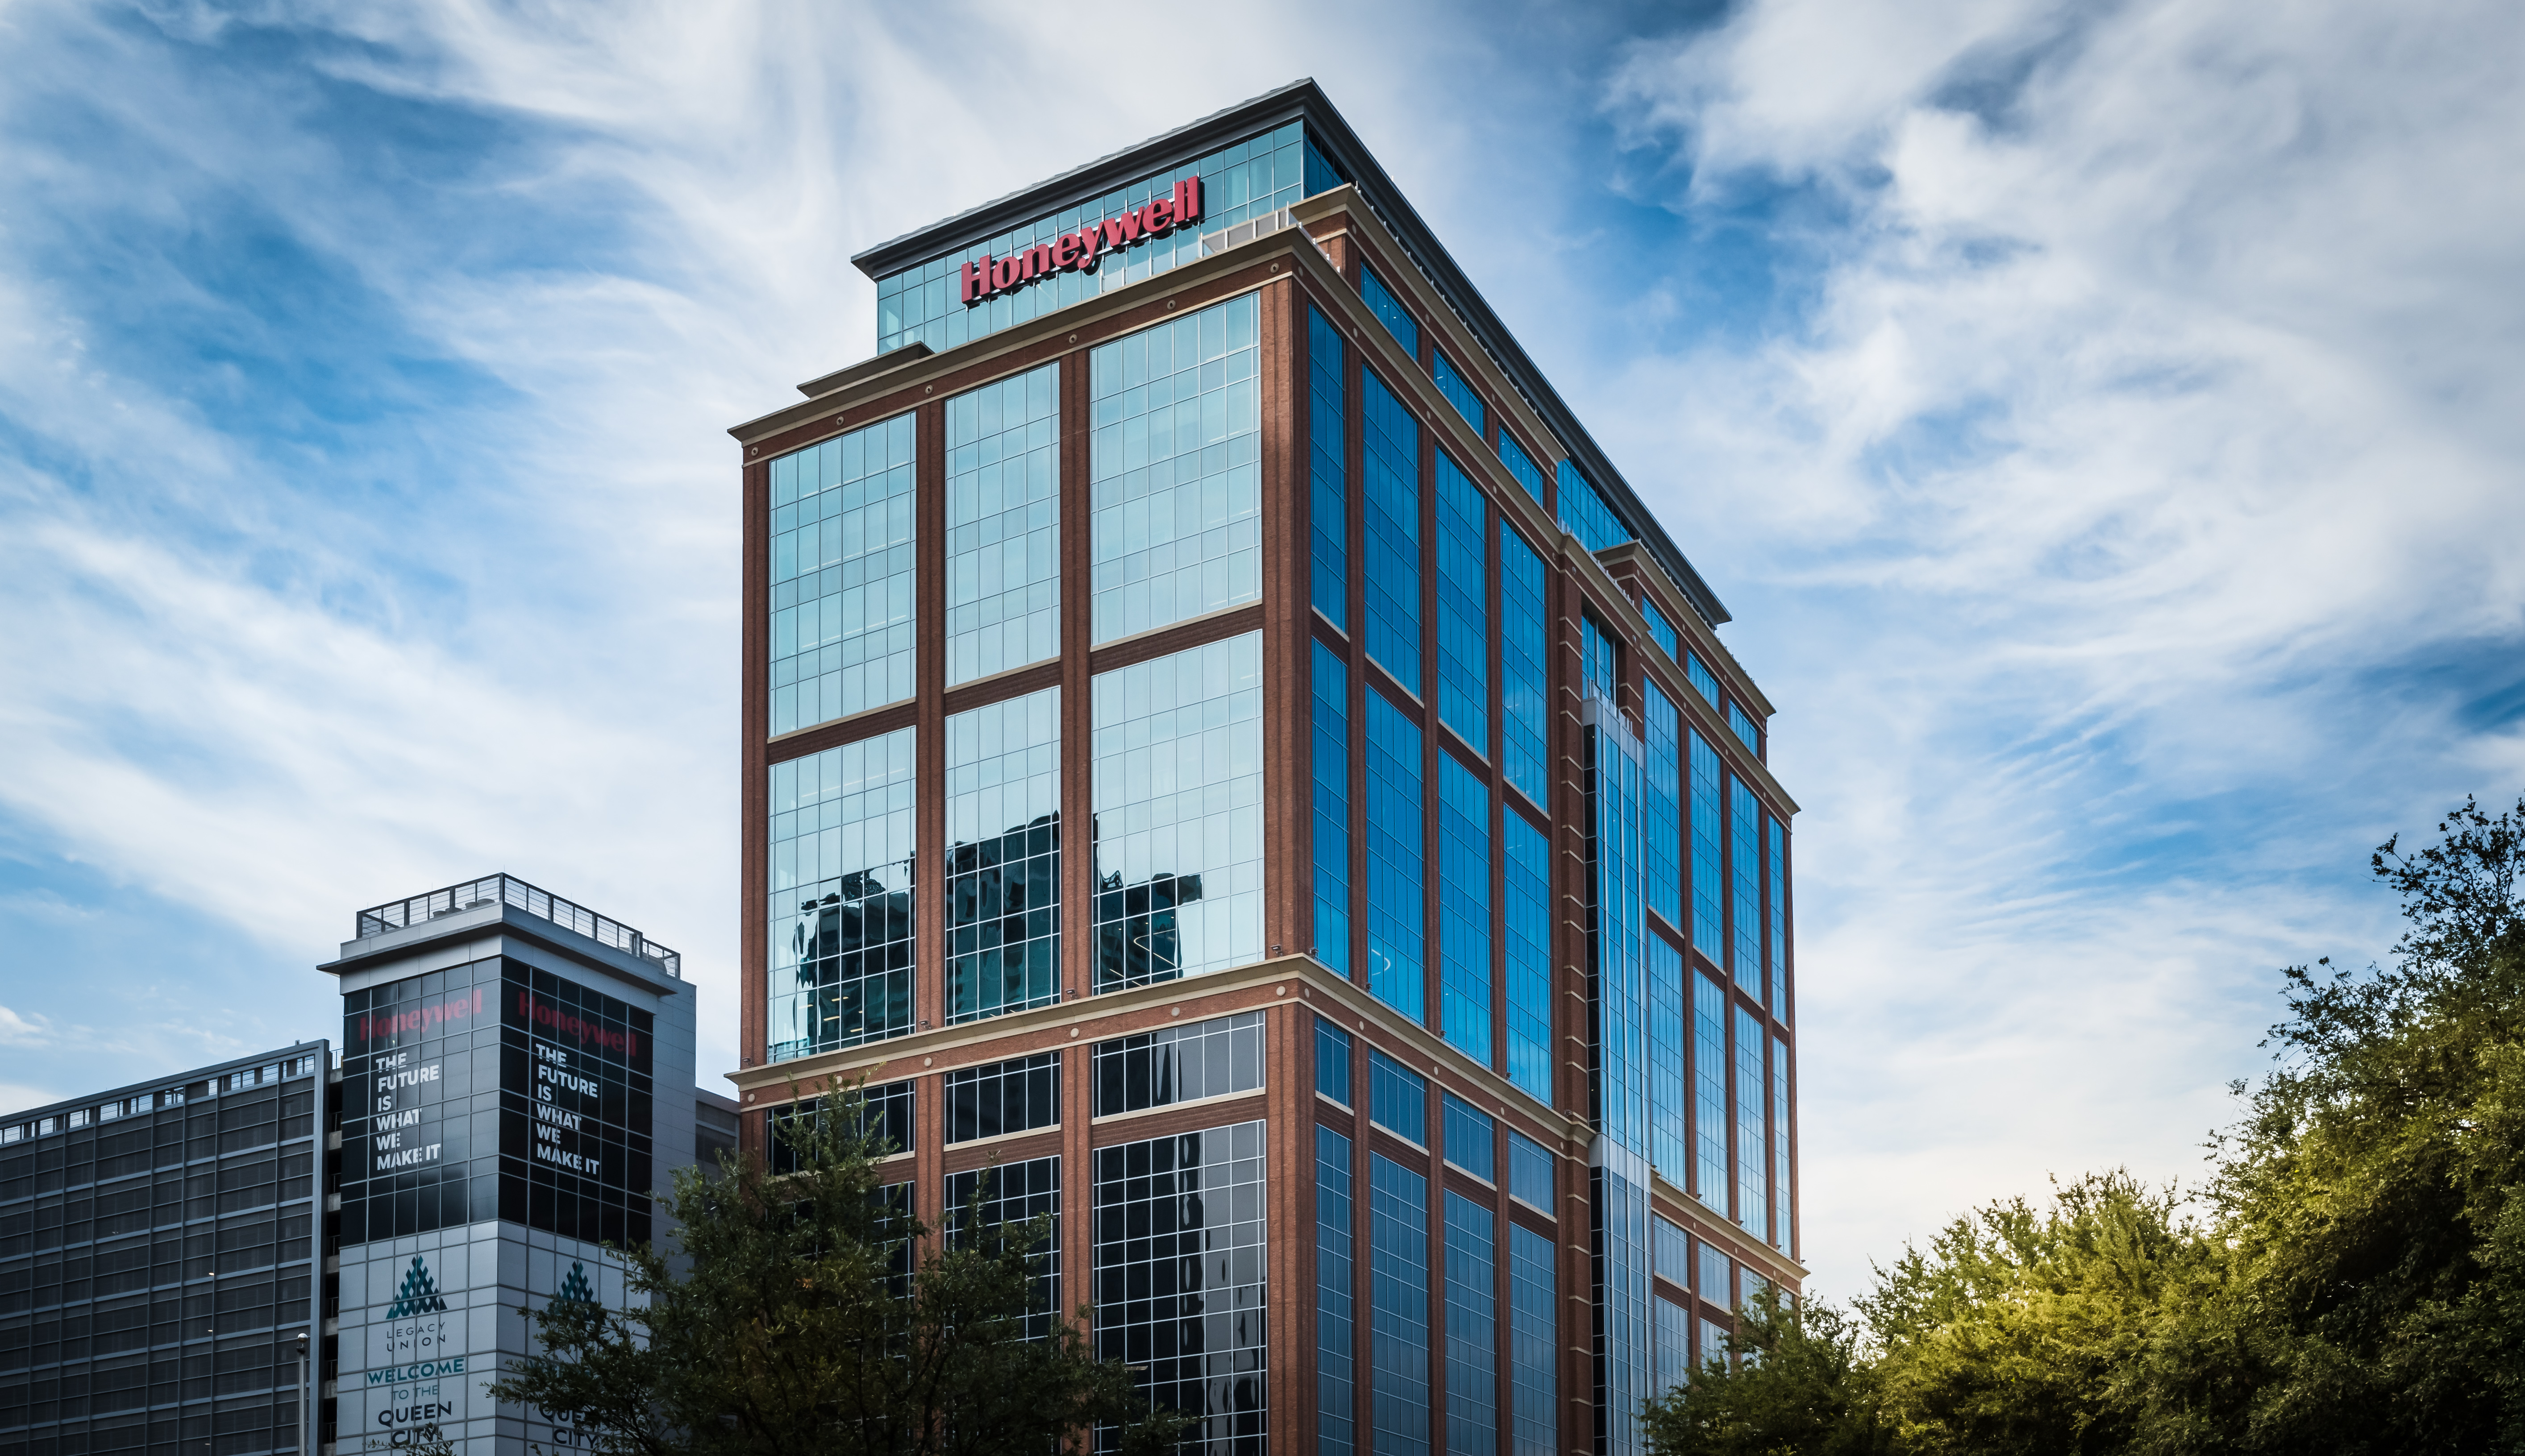
Photo: Scott Ritchie / Wikimedia Commons — 1 October 2021, archival; CC BY-SA 4.0 · Illustrative image.
Honeywell’s latest results look modest if you stop at the headline: sales increased just 1%. Read the reconciliation, and the business tells a stronger—but more complicated—story.
The company reported $4.994 billion of third-quarter sales, compared with $4.929 billion a year earlier. Organic growth was 7%, and management raised its full-year outlook. The distinction matters because Honeywell is changing its portfolio: comparing the sales of businesses it still owns with those it has sold can obscure how the remaining operations are performing.
The figures below come from Honeywell’s SEC-furnished earnings release, covering the quarter ended 30 September 2026. This is Honeywell Technologies, ticker HON, rather than the separately listed Honeywell Aerospace.
How 1% growth becomes 7%
The company’s reconciliation starts with 1% reported sales growth. Adjusting the prior-year comparison for divestitures takes that to 9%; removing a two-percentage-point acquisition contribution produces 7% organic growth. Currency and other adjustments were zero at the disclosed rounding level.
That makes organic growth useful for assessing the continuing businesses. It does not make reported sales irrelevant: the actual revenue base still determines the dollars available to cover costs and generate cash.
The clearest example is Industrial Automation. Its reported sales fell 23%, yet organic sales increased 4%. That is a portfolio-comparison issue, not evidence that the same underlying business simultaneously expanded and collapsed.
| Division | Q3 sales | Reported growth | Organic growth | Segment margin |
|---|---|---|---|---|
| Building Automation | $2.020bn | 8% | 8% | 27.0% |
| Process Automation and Technology | $1.859bn | 16% | 8% | 22.2% |
| Industrial Automation | $1.115bn | −23% | 4% | 18.4% |
Source: SEC release, segment results and organic-growth reconciliation. Organic growth and segment margin are company-defined non-GAAP measures.
Better margins, with one division moving backwards
GAAP operating income increased from $413 million to $740 million. The operating margin rose from 8.4% to 14.8%. Separately, Honeywell’s adjusted segment margin reached 21.3%, up from 17.6%.
Those are different measures. Calling the 21.3% figure the company’s GAAP operating margin would overstate the reported result.
Building Automation combined growth with a small margin improvement. Industrial Automation increased its segment margin by 3.5 percentage points, which management attributed primarily to pricing and productivity. Process Automation and Technology was the exception: its margin fell 2.1 percentage points, reflecting project mix and dilution from the Catalyst Technologies acquisition.
Our reading is that the operating improvement is substantive, but uneven. The next test is whether pricing, volume and cost savings can sustain it once the benefits from restructuring become harder to repeat.
Why earnings can fall while adjusted earnings rise
Diluted earnings per share from continuing operations were $2.40, down from $2.99. Adjusted EPS rose from $1.70 to $2.27. The prior-year Resideo termination gain is a major reason these comparisons point in opposite directions.
The release also reports $2.08 of total diluted EPS, including discontinued operations. It should not be mixed with the $2.40 continuing-operations figure or the $2.27 adjusted figure. With a changing corporate structure, the accounting perimeter is part of the story.
The cash-flow number needs its label too
Honeywell reported $607 million of operating cash flow from continuing operations and $77 million of capital spending. Subtracting the latter gives $530 million before the company’s further adjustments.
Its reported non-GAAP free cash flow was $688 million, because the reconciliation adds back $158 million of separation-related cash payments:
$607m operating cash − $77m capital spending + $158m separation payments = $688m adjusted free cash flow.
The adjustment can help readers assess an operation without separation costs. But those payments still used cash. Investors should understand both the underlying-business measure and the money actually left after capital spending, rather than treating them as interchangeable.
This is the same discipline we apply in our Bloom Energy earnings analysis: follow the bridge from profit to cash, and check exactly what a company excludes.
What the higher guidance asks investors to believe
| Full-year 2026 measure | Previous outlook | New outlook |
|---|---|---|
| Sales | $19.8–$20.0bn | $20.0–$20.1bn |
| Organic sales growth | 3%–4% | 4%–5% |
| Adjusted EPS | $8.05–$8.35 | $8.40–$8.45 |
| Company-defined free cash flow | About $2.0bn | About $2.1bn |
Management guidance, not achieved results. Source: SEC release, full-year guidance table.
The raised outlook supports management’s confidence, but it is not an assurance of future returns. Investors still need to judge the price paid for those expected earnings, the durability of margins and how much cash remains after unavoidable restructuring costs.
The strongest interpretation of this quarter is that the remaining automation businesses are growing more convincingly than the headline sales figure suggests. The caution is that acquisitions, disposals and adjustments make simple year-on-year comparisons unusually easy to misread.
Honeywell’s underlying growth is encouraging. Can it sustain that growth while turning the cleaner corporate structure into consistently stronger cash returns?
Follow Honeywell’s company page or browse Compound’s company earnings coverage.
Editorial interpretation and the $530m calculation are Compound’s. Figures are US dollars. General information, not personal investment advice.
Photograph: Scott Ritchie, Honeywell headquarters, Charlotte, 1 October 2021. Original source, CC BY-SA 4.0. Archival image, not a photograph of the results announcement. Display crops and resized derivatives use the same licence.