Thermo Fisher Earnings: Stronger Growth, Better Margins—and a Cash-Flow Test
Thermo Fisher reports $12.14bn revenue, 6% organic growth and stronger cash flow. Its SEC results also show why earnings adjustments and acquisition spending matter.
 Wealth / The Compound journal
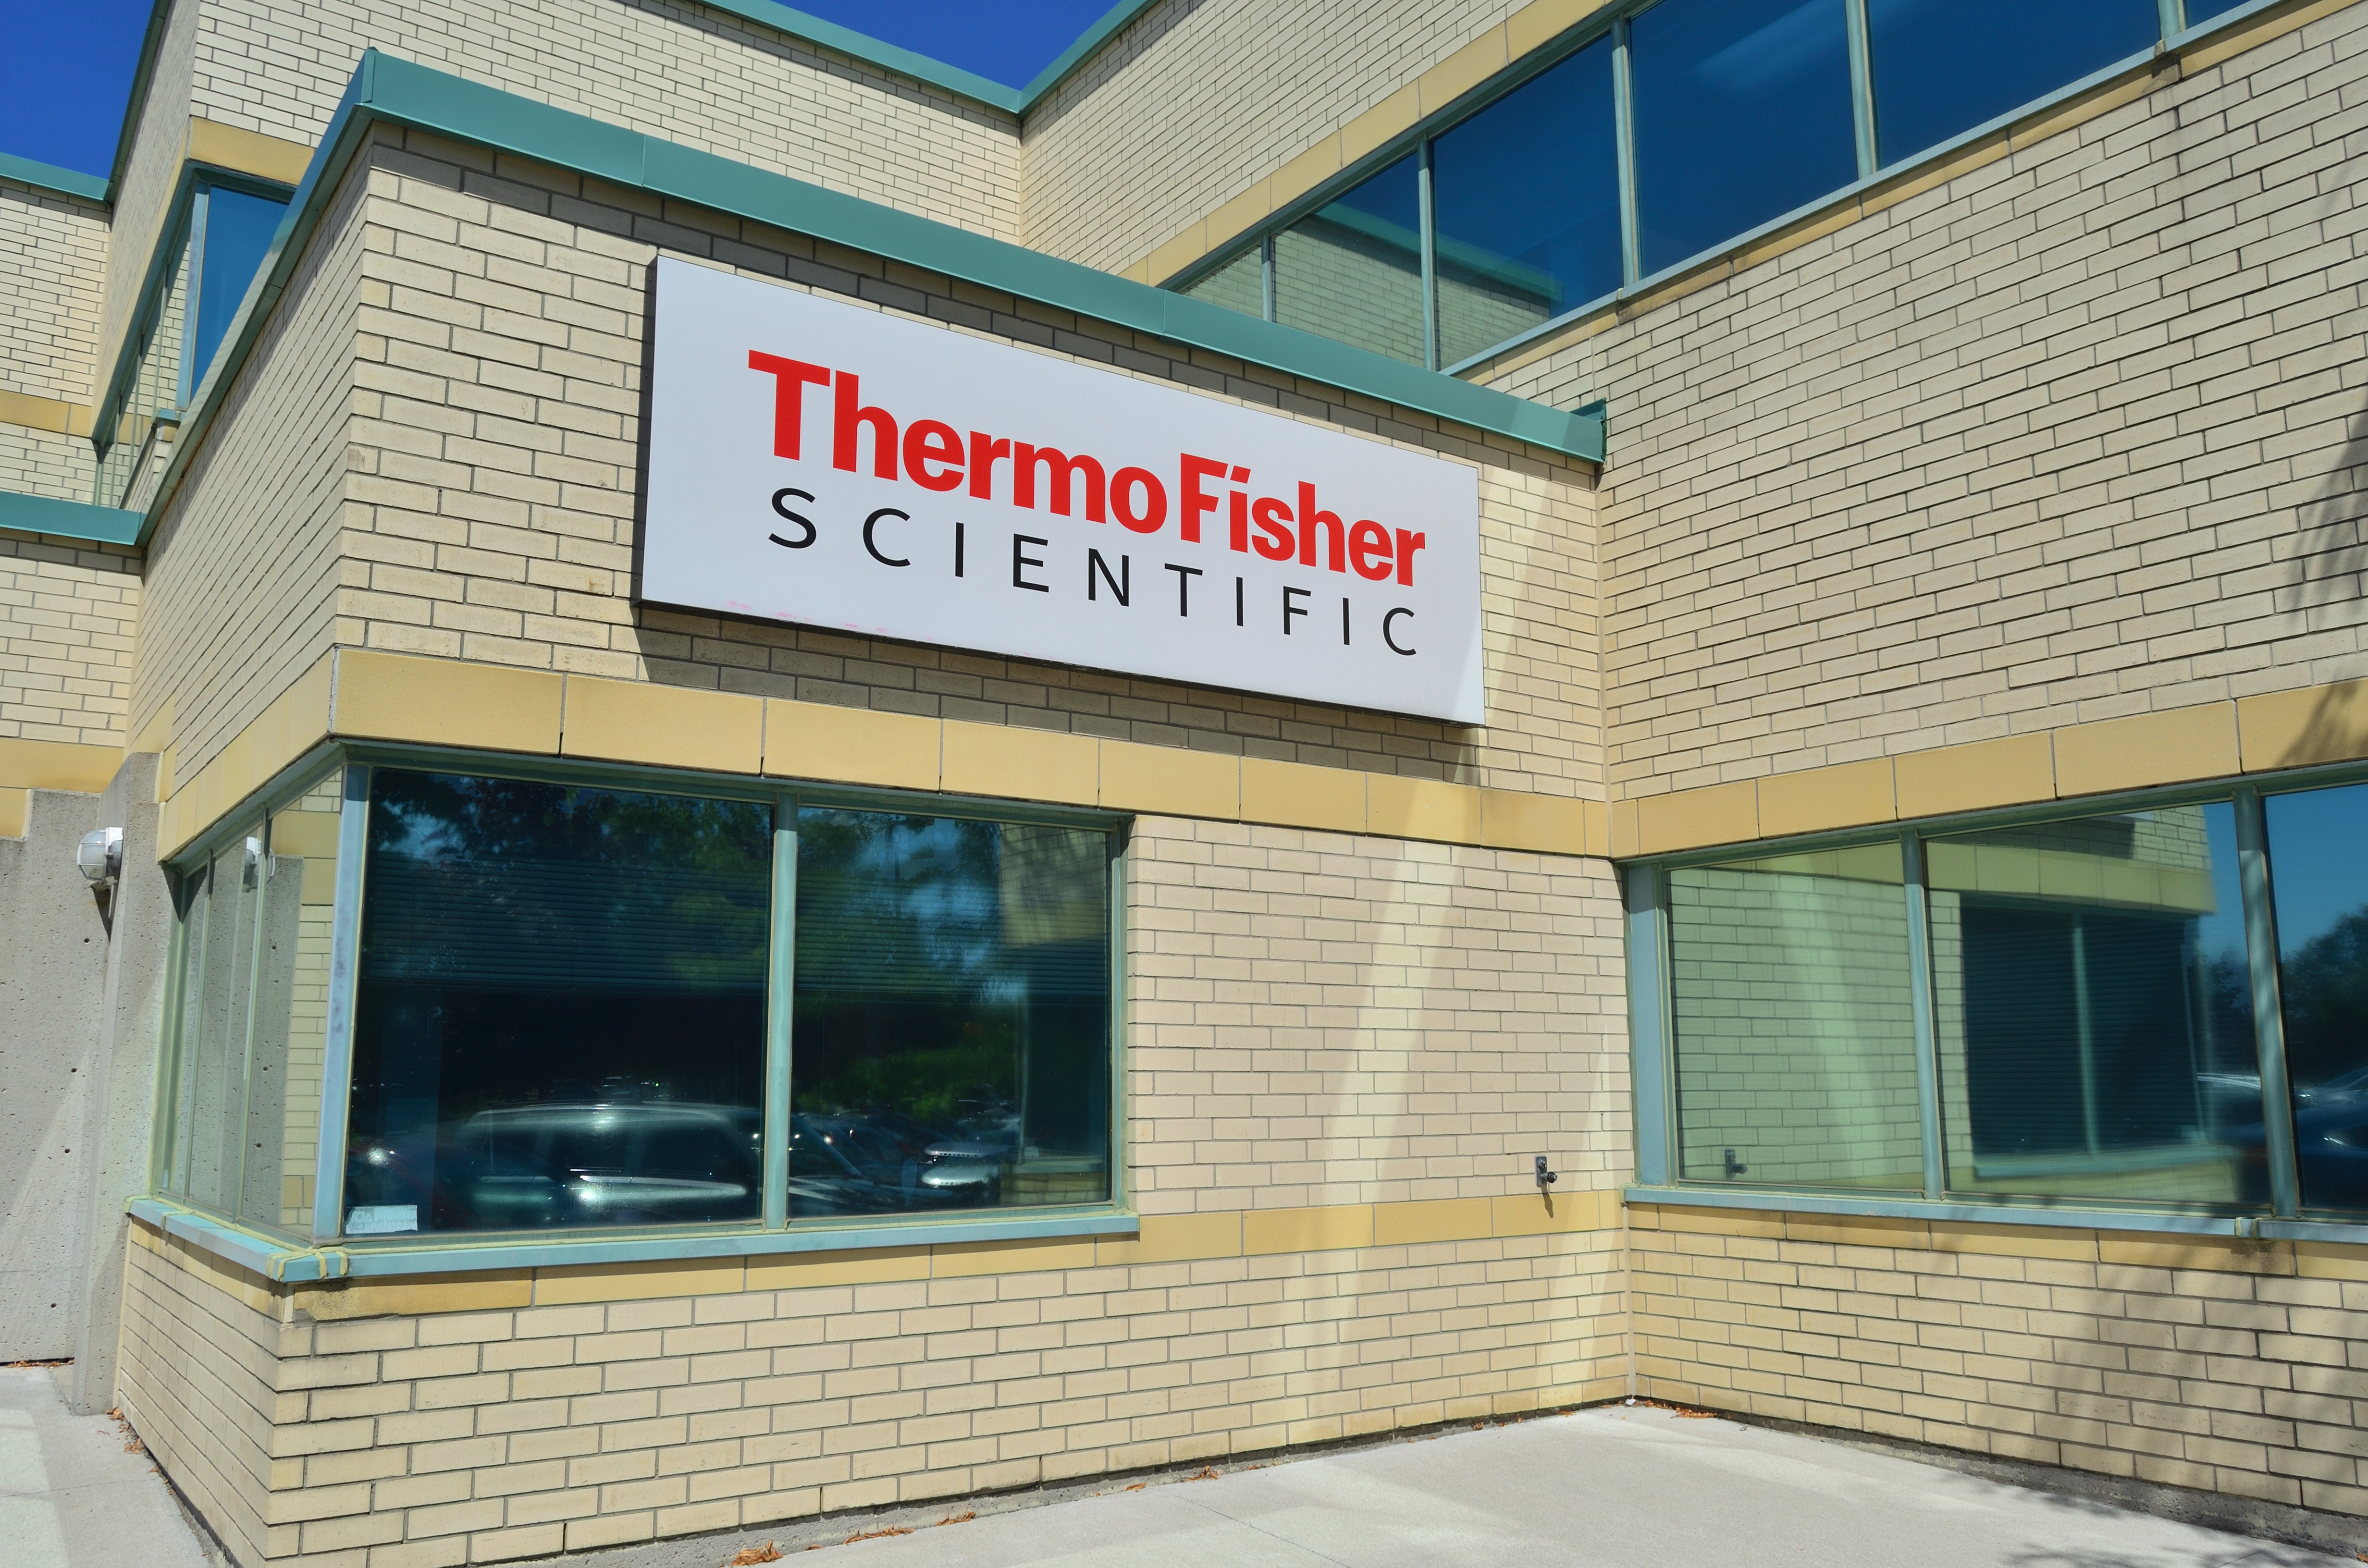
Photo: Raysonho / Wikimedia Commons — CC0 1.0; archival photograph, 14 August 2019 · Illustrative image.
Thermo Fisher’s latest results offer a more convincing growth story than the headline alone suggests. Revenue rose 9%, but the more useful signals are 6% organic growth, wider operating margins and stronger cash generation.
For investors, the question is whether the company can sustain that combination while earning adequate returns on its acquisition spending. The quarter provides encouraging evidence on operations. It also shows why adjusted earnings should be read alongside the statutory numbers.
Thermo Fisher Scientific reported $12.137 billion in revenue for its fiscal third quarter ended 26 September 2026. The results were released on 21 October and furnished in Exhibit 99.1 to its SEC Form 8-K. These are reported results, not analyst forecasts.
Thermo Fisher earnings at a glance
| Metric | Q3 2026 | Q3 2025 | Change |
|---|---|---|---|
| Revenue | $12.137bn | $11.122bn | +9.1% |
| GAAP operating income | $2.263bn | $1.941bn | +16.6% |
| GAAP operating margin | 18.6% | 17.4% | +1.2 percentage points |
| Net income attributable to Thermo Fisher | $1.721bn | $1.616bn | +6.5% |
| GAAP diluted EPS | $4.64 | $4.27 | +8.7% |
| Adjusted diluted EPS, non-GAAP | $6.68 | $5.79 | +15.4% |
| Free cash flow, non-GAAP | $2.115bn | $1.840bn | +14.9% |
Source: SEC earnings release. Percentage changes calculated from reported figures; company headlines round revenue growth to 9% and adjusted EPS growth to 15%.
Organic growth makes the revenue increase more meaningful
Acquisitions can enlarge a business without showing how its existing operations are performing. Thermo Fisher’s reconciliation separates its 9% reported revenue growth into 6% organic growth, a 3-percentage-point contribution from acquisitions and divestitures, and no currency contribution at the reported precision.
That distinction strengthens the result. Most of the rounded growth rate came from the business after excluding acquisition, disposal and currency effects. It does not, however, tell investors how much came from pricing rather than volumes: organic revenue is not a pure measure of unit demand.
Thermo Fisher serves laboratories, pharmaceutical manufacturers and clinical research through businesses including Thermo Scientific, Fisher Scientific, Patheon and PPD. Its broad exposure makes these results useful evidence about spending across the scientific supply chain, although one company’s performance cannot establish that every biotech customer or research market is recovering.
Laboratory products and biopharma services lead the expansion
The largest reported sales increase came from Laboratory Products and Biopharma Services, where quarterly revenue rose from $5.970 billion to $6.863 billion, approximately 15%. Segment income increased to $1.067 billion, with its margin moving from 14.5% to 15.5%.
Elsewhere, Life Sciences Solutions revenue increased about 5% to $2.719 billion, and Analytical Instruments grew about 6% to $2.002 billion. Specialty Diagnostics revenue declined around 6% to $1.098 billion, even as its segment income increased.
The picture is therefore uneven rather than uniformly strong. The company also completed its microbiology-business divestiture during the quarter. Investors should consider portfolio changes before treating reported segment movements as like-for-like demand trends.
Segment revenue figures include intersegment activity and require eliminations to reconcile to consolidated sales. Segment income also reconciles to adjusted operating income; it is not the same as consolidated GAAP operating profit.
Q1 to Q3: margins improve, but GAAP EPS is not rising every quarter
| Reported metric | Q1: 28 March 2026 | Q2: 27 June 2026 | Q3: 26 September 2026 |
|---|---|---|---|
| Revenue | $11.005bn | $11.994bn | $12.137bn |
| GAAP operating income | $1.863bn | $2.087bn | $2.263bn |
| GAAP operating margin | 16.9% | 17.4% | 18.6% |
| GAAP diluted EPS | $4.43 | $4.68 | $4.64 |
| Adjusted EPS, non-GAAP | $5.44 | $6.03 | $6.68 |
Sources: Q1 and Q2 SEC 10-Q filings and the Q3 earnings release. Fiscal period-end dates are shown explicitly.
Q3 revenue increased approximately 1.2% from Q2, while GAAP operating income rose about 8.4%. That is evidence of improved operating profitability within the quarter sequence, although seasonality and business mix mean it should not be extrapolated mechanically.
GAAP EPS slipped from $4.68 to $4.64 even as adjusted EPS increased. That divergence is exactly why the two earnings measures deserve separate attention. The Thermo Fisher stock page contains the interactive price chart and continuously updated quarterly financial comparisons.
The $2.04 gap between reported and adjusted EPS
Adjusted EPS of $6.68 was $2.04 above GAAP EPS of $4.64. The largest adjustment was $1.40 per share for amortisation of acquisition-related intangible assets, followed by $0.54 for restructuring and other costs, with further positive and negative adjustments.
At the operating-profit level, the reconciliation adds back $519 million of acquisition-related amortisation and $199 million of restructuring and other costs, among other items. The restructuring category includes disposal-related gains and losses; it is not simply a redundancy bill.
Adjusted figures can help compare operations across periods with different acquisition accounting. They do not make acquisition prices, restructuring expenditure or investment returns irrelevant. For an acquisitive company, both views are necessary: how the businesses perform and what shareholders paid to own and reorganise them.
Cash flow supports the result—but acquisitions still absorb capital
Quarterly operating cash flow reached $2.551 billion. After $437 million of capital expenditure and including $1 million of property-sale proceeds, Thermo Fisher reported $2.115 billion of free cash flow under its non-GAAP definition.
For the first nine months, free cash flow rose to $4.618 billion, from $3.319 billion a year earlier—approximately 39% growth. That is a substantial improvement, although working-capital movements affect cash conversion and a strong period is not a guarantee of the same growth next year.
The capital-allocation context matters. During those nine months, cash acquisitions, net of cash acquired, totalled $8.877 billion. The company also repurchased $4.000 billion of shares and paid $511 million in dividends. Its free-cash-flow measure excludes acquisition spending.
Cash and equivalents ended the quarter at $5.461 billion, while short- and long-term obligations totalled $41.370 billion. Those balances do not by themselves establish financial strain, but they make acquisition returns, interest costs and future cash generation central to the investment case.
What about Thermo Fisher’s 2026 guidance?
The SEC earnings release does not provide updated numerical full-year guidance. It says management will present the update during the 21 October earnings call at 7am Eastern Time—noon in Ireland.
This article assesses the published earnings release. It does not treat the earlier Q2 outlook as a newly announced Q3 forecast, or assume that strong results automatically mean guidance has been raised.
What investors should take from the quarter
Thermo Fisher’s strongest evidence is the combination of organic growth, improved operating margins and cash generation. The less comfortable questions concern the size of the adjustments, uneven segment performance and the returns required on substantial acquisition spending.
For investors following pharmaceutical manufacturing and research activity, those operating trends are worth watching alongside Eli Lilly and Danaher, while recognising their different business models.
This was a stronger operating quarter. Whether it makes TMO an attractive investment depends on the valuation and the durability of that improvement—not simply on the 15% adjusted-EPS headline.