Duke Energy Is Spending $12.6 Billion Before the New Load Arrives. Who Funds the Gap?
Duke Energy is building ahead of data-centre and manufacturing demand. The investment question is whether regulated returns and new load can outrun debt, equity and customer-bill pressure.
 Wealth / The Compound journal
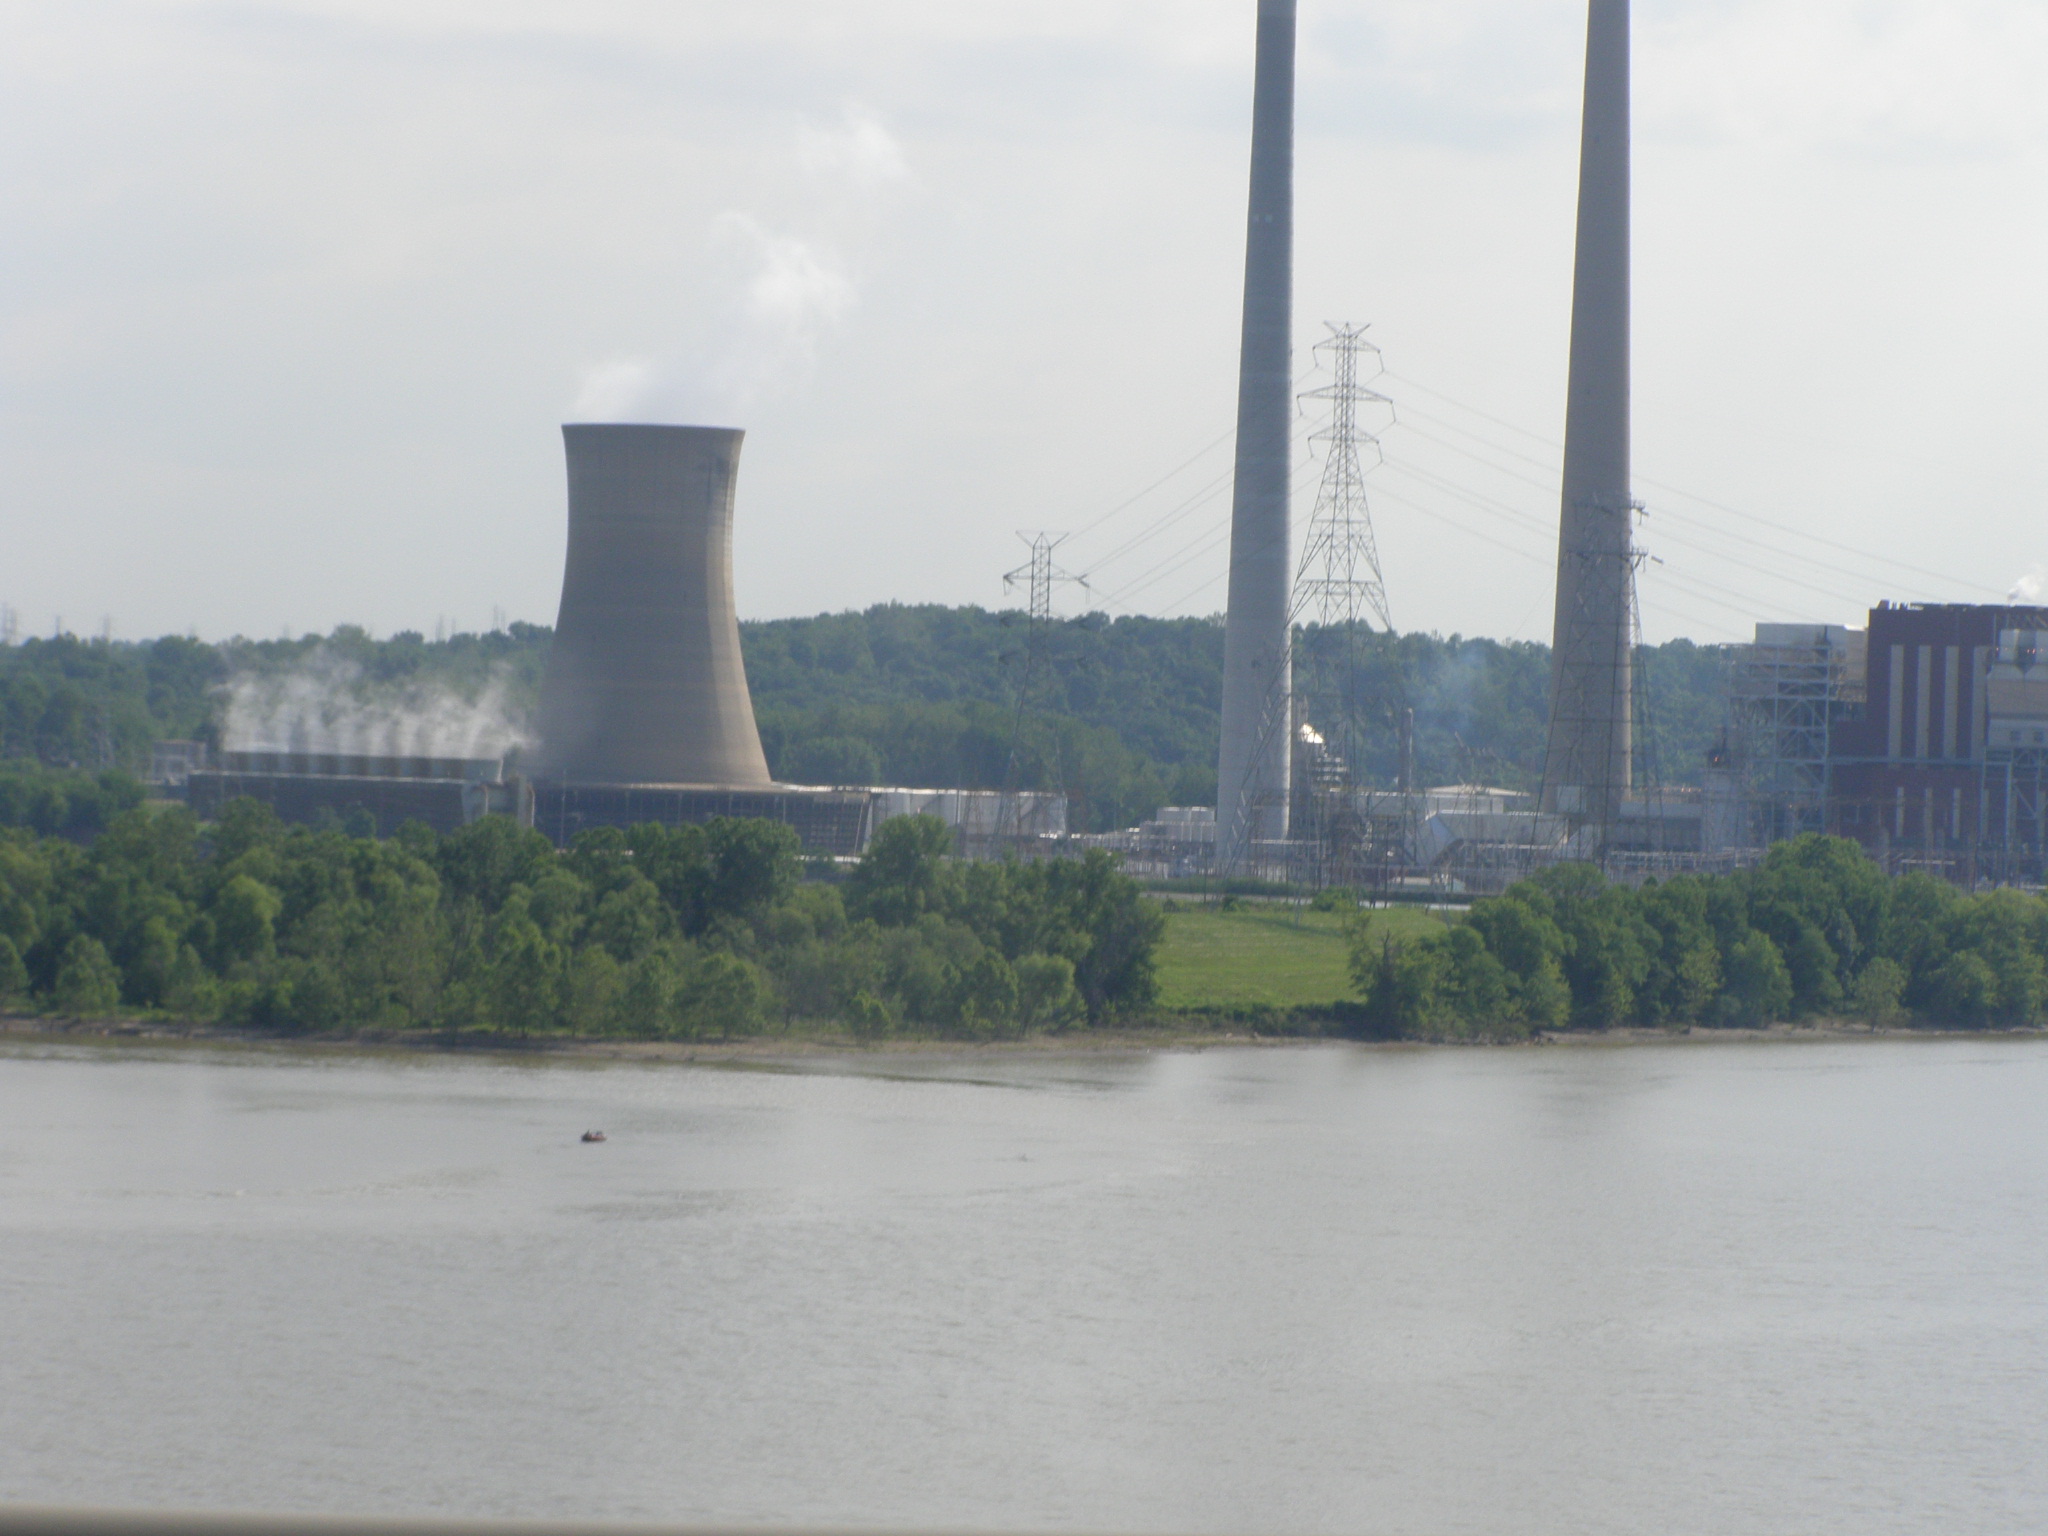
Photo: Chris Light / Wikimedia Commons, CC BY-SA 4.0. Archival photograph taken 18 June 2008; cropped for publication. · Illustrative image.
Duke Energy is investing before much of the demand it expects has arrived. That is normal for a regulated utility, but the scale makes the funding question unusually important.
For the nine months ended 30 September 2026, Duke reported $7.89 billion of operating cash flow and $12.57 billion of capital expenditure. The simple gap was therefore about $4.68 billion, before dividends and other investing needs. A year earlier, the equivalent gap was about $1.21 billion.
Management says it is executing a generation build that will add 16 gigawatts of capacity by 2031. If new data centres, factories and households use that infrastructure—and regulators allow Duke to earn an adequate return—the spending can expand the earnings base. If load arrives late, financing costs rise or customer bills become politically difficult, shareholders can carry more of the burden.
For the maintained financial record, see Duke Energy’s stock profile. This article examines the financing and return test behind the build.
The earnings result already shows both sides
Duke reported third-quarter GAAP and adjusted earnings of $1.99 per share, up from $1.81. Electric Utilities and Infrastructure segment income rose to $1.82 billion from $1.66 billion.
Management attributed the improvement primarily to recovery of infrastructure investment and favourable weather. Higher depreciation, interest expense and minority-interest effects offset part of the benefit. That is the utility investment cycle in miniature: new assets can support regulated earnings, but the debt and depreciation begin to matter as the asset base grows.
The company narrowed its 2026 adjusted EPS guidance to $6.70–$6.80 and reaffirmed a management target of 5%–7% annual adjusted EPS growth through 2030. Guidance is not a guaranteed return. It depends on capital projects entering service, regulatory recovery, financing and actual electricity demand.
Cash flow does not fund the build by itself
Operating cash flow fell by $783 million in the first nine months, while capital expenditure increased by $2.69 billion. Subtracting capex from operating cash is not Duke’s reported free-cash-flow measure, and it is not automatically a warning sign: regulated utilities routinely finance long-lived assets with debt and equity before recovering the investment over time.
It does show why the capital structure matters. At 30 September, Duke reported $84.33 billion of long-term debt, $6.12 billion of current maturities and $2.34 billion of notes payable and commercial paper. Together those balance-sheet categories total approximately $92.79 billion.
Duke also received $2.50 billion from selling Piedmont Natural Gas’s Tennessee business during the nine-month period. That sale helped fund the programme, but it is not recurring operating cash.
The right question is not whether capex exceeds cash flow in a single period. It is whether the financing mix preserves per-share economics while the assets move from construction into the regulated rate base.
Load growth has to be contracted, not merely forecast
The 16-gigawatt plan is tied to growing electricity needs across Duke’s service territories. Large data centres and advanced-manufacturing projects can improve system utilisation and spread fixed costs across more demand. They can also require generation and transmission capacity years before full consumption begins.
The filing identifies lower-than-expected load growth—particularly if data-centre usage falls short—as a risk. That disclosure matters because a forecast pipeline is not the same as an operating customer. Investors need to distinguish projects under construction, binding service agreements and earlier-stage enquiries.
Customer protections matter too. Large-load tariffs, minimum-payment commitments and cost-allocation rules can reduce the risk that households finance infrastructure built for a small number of corporate users. The quality of those arrangements is as important as the headline megawatts.
Regulation determines the return clock
Utilities do not earn simply by spending. State regulators decide which investments are prudent, when costs enter rates and what return Duke may earn. Construction work in progress, riders and rate cases can shorten the delay between cash expenditure and recovery; disallowances or slower approvals can extend it.
Duke’s third-quarter result shows infrastructure recovery already helping earnings. It also shows the counterweight: interest and depreciation rose as the asset base expanded. The investment case strengthens if regulated earnings grow faster than financing costs without creating bill pressure that weakens political support.
What would confirm the thesis?
Three developments would be constructive. First, large-load projects should convert into enforceable agreements and begin consuming electricity on schedule. Second, operating cash should rise as investments enter service, narrowing the funding gap relative to capex. Third, Duke should maintain its credit position and limit dilution while securing timely regulatory recovery.
The counter-case is that the company builds ahead of demand, funds more of the programme with expensive debt or equity, and faces resistance to the rates needed for an adequate return. In that outcome, asset growth need not produce attractive per-share growth.
Duke Energy’s spending can create a larger regulated earnings base, but construction is only the first step. The payoff depends on real load, enforceable customer protections and regulation that converts capital into cash without overloading either the balance sheet or customer bills.
Explore Compound’s earnings hub and our guide to investment diversification.
Reported figures are in US dollars and relate to Q3 or the first nine months of 2026 as stated. Adjusted EPS and long-term growth targets are management’s non-GAAP measures or guidance. The cash-minus-capex and debt totals are Compound calculations from reported balance-sheet and cash-flow categories. Facts come from Duke Energy’s results release and Form 10-Q; interpretation is Compound’s. General information, not personal investment advice.
Cover: Chris Light, Wikimedia Commons, under CC BY-SA 4.0. Archival photograph of Duke Energy Ohio’s Miami Fort station taken 18 June 2008; cropped for publication and not presented as a current facility image.