Apple’s $39.9 Billion Vendor Receivables: How Much Sits With Two Manufacturers?
Apple’s component-related receivables grew sharply in the September quarter. Two unnamed vendors account for roughly $28.7 billion, making collection and concentration worth watching alongside device sales.
 Wealth / The Compound journal
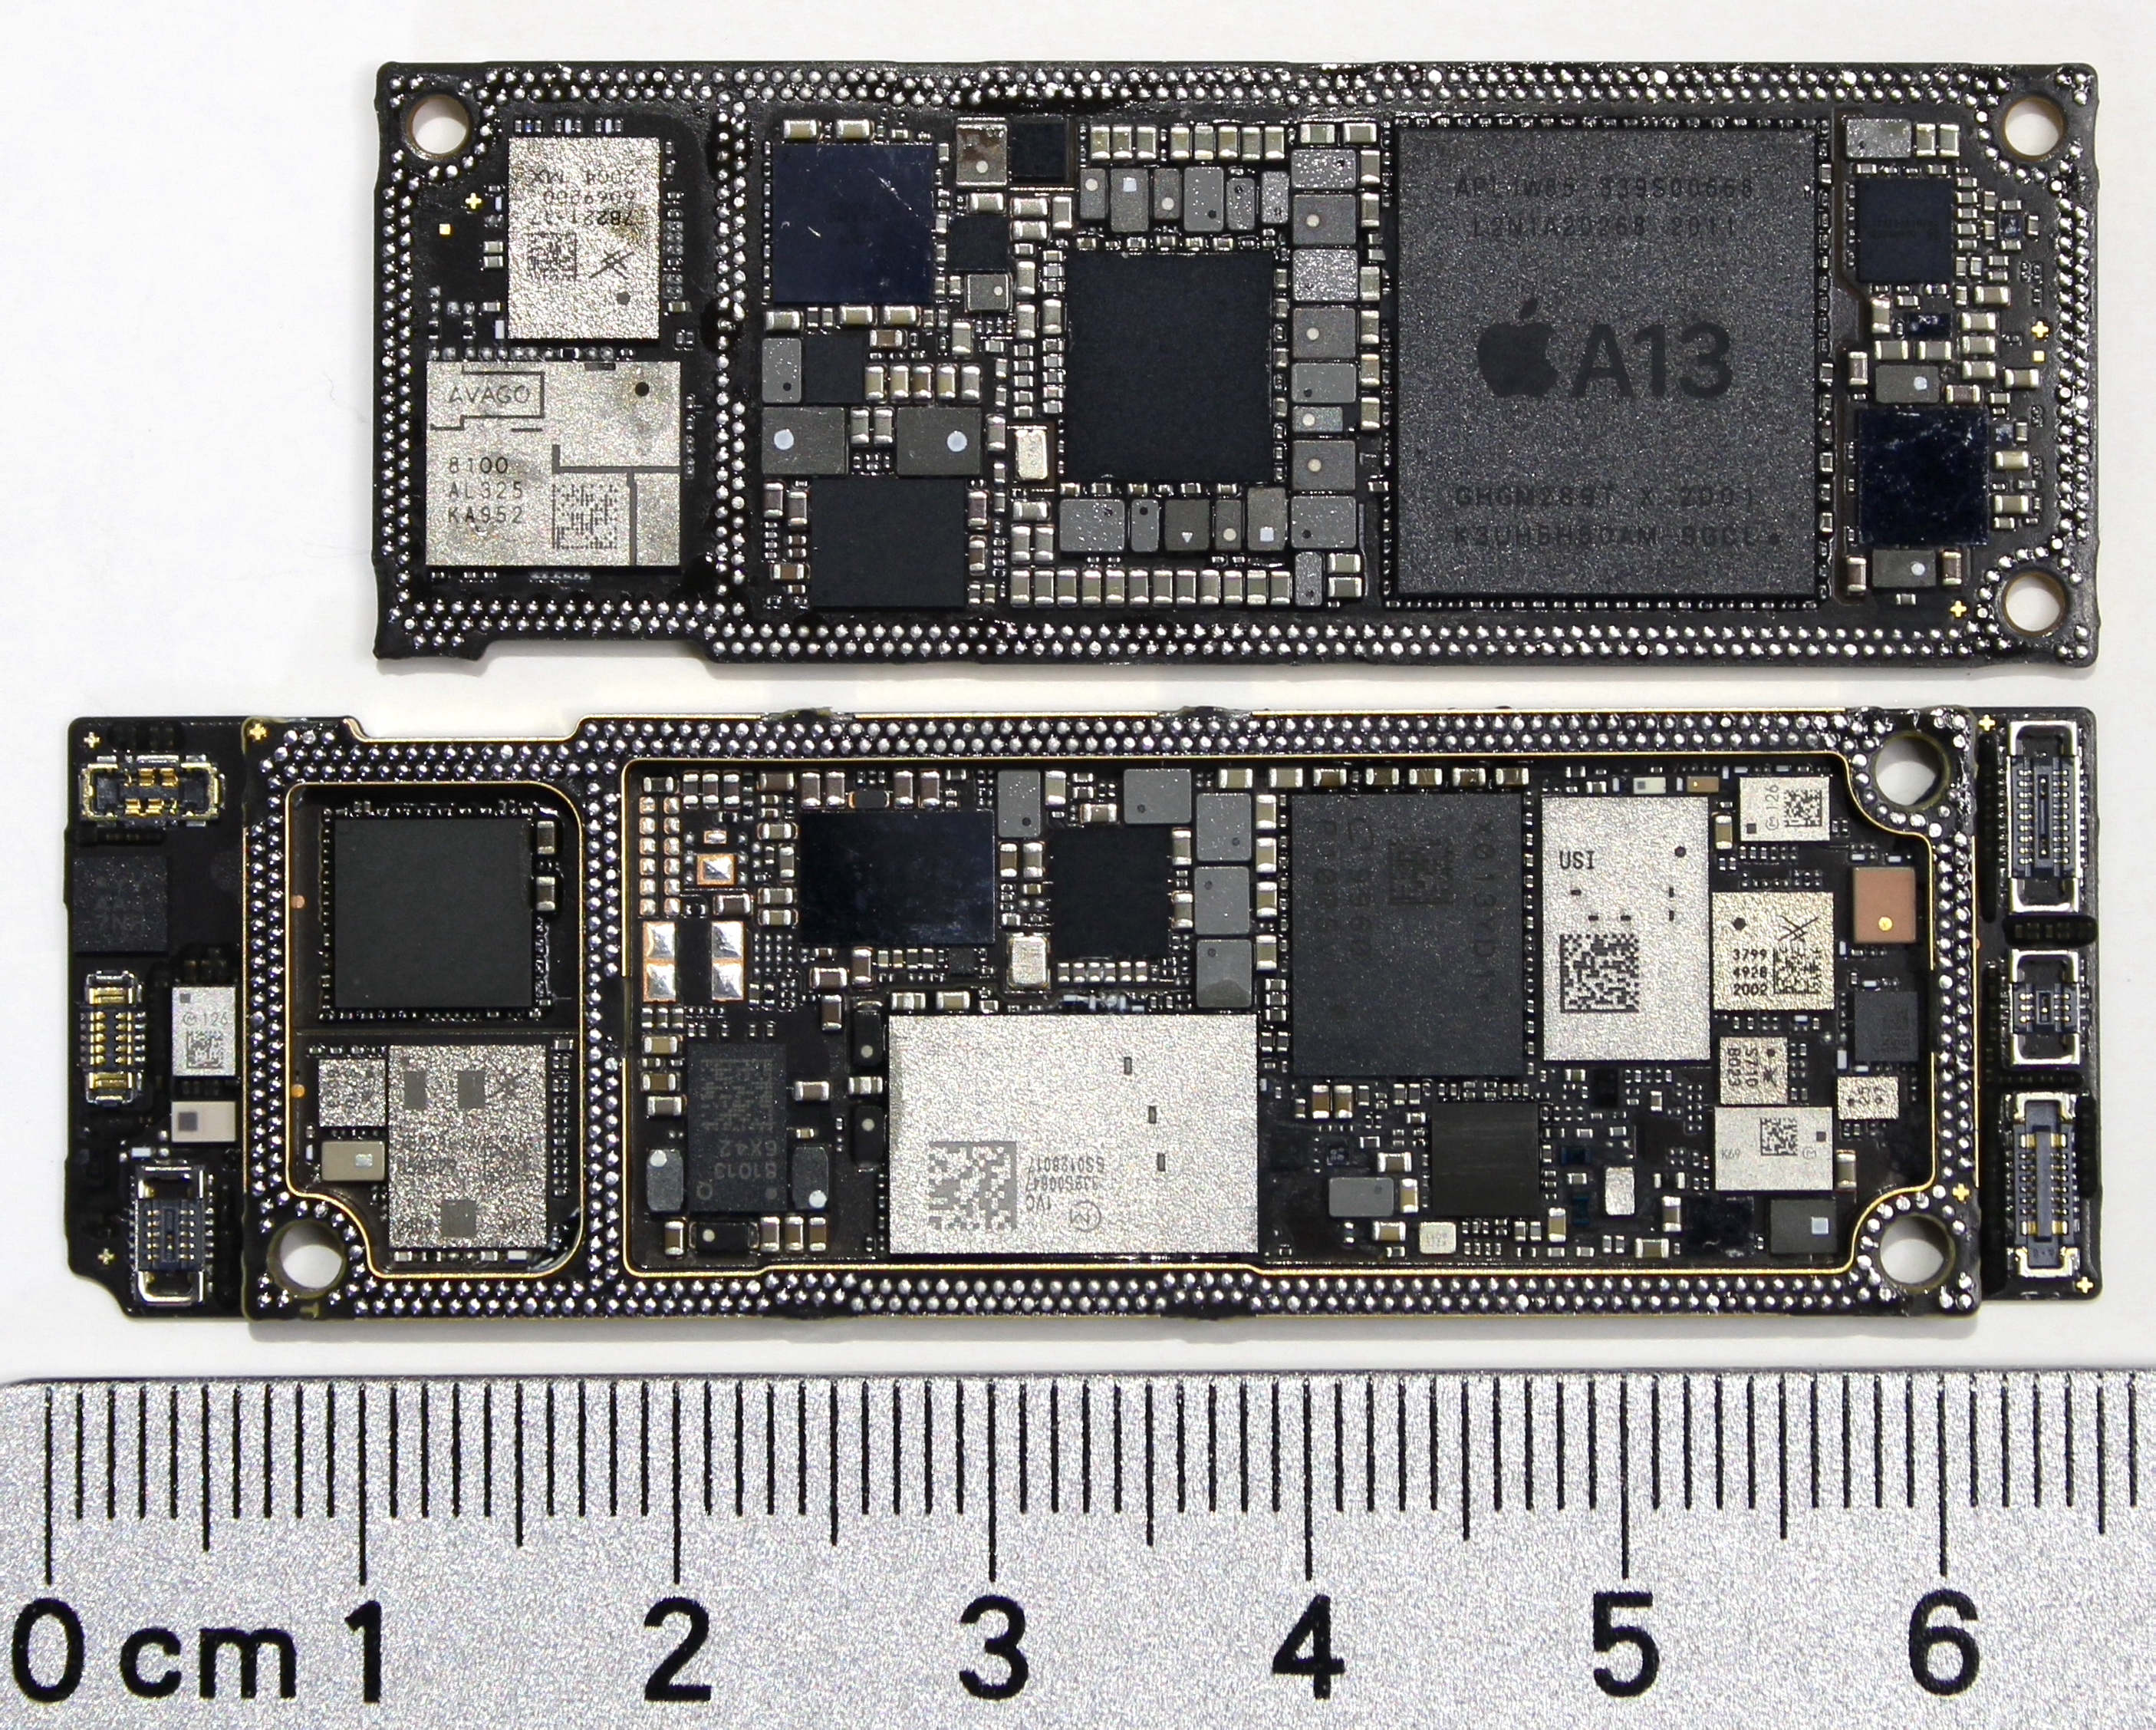
Photo: Sonic8400 / Wikimedia Commons / CC BY-SA 4.0 (https://creativecommons.org/licenses/by-sa/4.0/). Archival: 28 December 2020. Resized and cropped. · Illustrative image.
Apple’s manufacturing relationships create an asset that can be easy to overlook: money owed to Apple for components supplied to its manufacturing vendors. At its September year-end, that balance reached $39.9 billion, with approximately $28.7 billion concentrated in two unnamed vendors.
The investor question is whether this larger, concentrated balance converts back into cash smoothly. It is not evidence that a supplier has defaulted. This analysis uses the fiscal 2026 annual filing published on 3 November and the preceding quarterly filing; it does not describe a new event on 19 November.
Why a manufacturer owes Apple money
Apple purchases components and sells some to vendors that assemble its products. Those transactions create vendor non-trade receivables. They are separate from money owed by customers buying finished devices. Apple excludes these component sales from product revenue; any gain reduces product cost of sales when the related finished products are sold. The annual filing describes the vendor receivables as unsecured. Source: FY2026 10-K, Note 4 and credit-risk discussion.
That distinction prevents two analytical mistakes. Adding the receivables to device revenue would count a different stage of production as an extra customer sale. Treating them as cash available for immediate buybacks would ignore collection timing and counterparty risk.
A larger balance, with more concentrated exposure
| Reporting date | Vendor receivables | Two largest disclosed shares | Approximate combined exposure |
|---|---|---|---|
| 27 September 2025 | $33.180bn | 46% + 23% = 69% | $22.9bn |
| 27 June 2026 | $27.509bn | 47% + 22% = 69% | $19.0bn |
| 26 September 2026 | $39.896bn | 45% + 27% = 72% | $28.7bn |
Sources: the annual report and June 2026 Form 10-Q, Note 4. Exposure amounts are Compound estimates obtained by multiplying balances by the disclosed, rounded percentages. Apple does not identify the vendors in these disclosures, so the table cannot establish that the same counterparties occupy both positions at every date.
Total vendor receivables rose $12.387 billion, or 45.0%, from June, and 20.2% year on year. The approximate exposure represented by the two largest disclosed shares increased about $9.7 billion from June. This combines a larger receivable pool with a three-percentage-point increase in concentration.
Scale matters even without evidence of financial distress. A delayed settlement at a major counterparty can affect cash availability more than the same delay spread across many small counterparties. The filing supplies the size of the exposure, but it does not supply enough evidence here to estimate a default probability, identify overdue balances or name a distressed manufacturer.
Reconcile the cash effect before calling it a loss
The June cash-flow statement records a $5.671 billion inflow from changes in vendor receivables during the first nine fiscal months. The full-year statement records a $6.716 billion outflow from that line. Subtracting the nine-month amount from the annual amount gives a $12.387 billion fourth-quarter cash-flow use: −6.716 − 5.671 = −12.387.
That agrees with the June-to-September balance-sheet increase. It is a working-capital movement, not a $12.4 billion write-off or a standalone expense. Nor does it establish the gross volume of component purchases or collections during the quarter; offsetting transactions occur within the period.
Apple’s 2 November results release reported approximately $28 billion of quarterly operating cash flow. The receivables movement is already incorporated in operating cash flow. Subtracting it again would understate cash generation. Conversely, adding it back and calling the result permanently available cash would assume the entire balance reverses without replacement.
What would improve or weaken the investment case?
A useful follow-up is to track the balance, concentration and cash-flow contribution together. A declining receivable balance with continued product sales would be consistent with cash being released from this part of the production cycle. A continuing increase would require more working capital, even if reported earnings remained strong. Neither observation alone establishes the quality of a particular vendor.
An illustrative 10% change in the latest balance equals about $4.0 billion. That is a sensitivity to show scale, not a forecast of collections or losses. Settlement terms, product timing and new component flows would determine the actual outcome.
Our Apple purchase-commitments analysis examines obligations to buy future supply. This article examines an existing asset and the concentration of amounts owed to Apple. Investors should keep the two separate rather than add them together as a single cash loss. Follow the Apple stock profile for the continuing financial report and the Apple stock guide for the wider investment framework.
Investment analysis for information, not a personal recommendation. Archival iPhone 11 photograph by Sonic8400, 28 December 2020, via Wikimedia Commons, CC BY-SA 4.0. The resized photograph and crops retain that licence.