Amazon’s advertising growth slowed. How much can Prime Day explain?
Amazon’s advertising growth fell to 12% excluding currency effects. A nine-month comparison offers a better starting point than extrapolating a quarter distorted by Prime Day.
 Wealth / The Compound journal
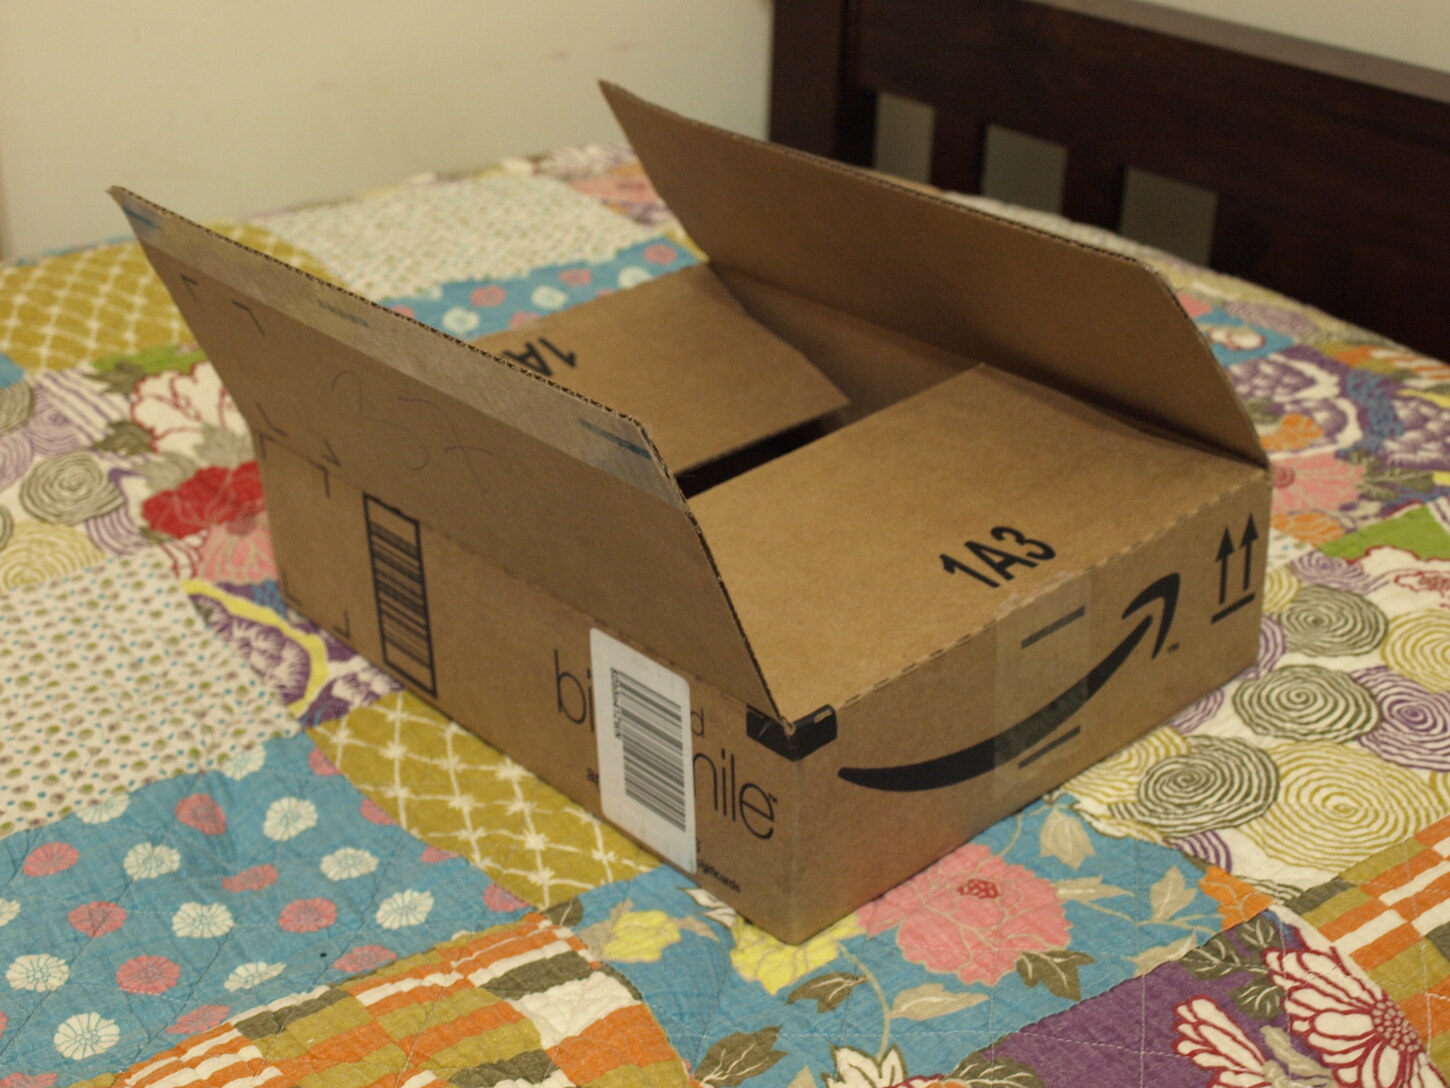
Photo: Matthew Paul Argall via Wikimedia Commons, CC BY-SA 3.0. Archival photograph, 15 February 2012. Resized and cropped. · Illustrative image.
Amazon’s advertising growth dropped from 26% excluding currency effects in Q2 to 12% in Q3. That is a large slowdown for a business investors often treat as a source of growth alongside retail. Before changing a valuation, however, investors need a comparison that gives both years the same opportunity to earn Prime Day advertising revenue. Amazon’s quarterly supplemental data
A sale moved between quarters
In 2026, Prime Day took place in Q2 in most large countries. In 2025 it occurred entirely in Q3. Amazon had already flagged the effect on its sales comparison when it released second-quarter results. The event moved into the earlier quarter without disappearing from the year. Amazon’s Q2 results
An advertiser bidding to reach shoppers during a promotion may move spending with that promotion. A quarter losing the event can therefore look weaker even if the underlying appetite to advertise is unchanged. That is an economic explanation to test against a longer period, rather than a reason to dismiss every sign of slower growth.
Put the missing quarter back into the comparison
Amazon’s 10-Q discloses advertising revenue for both the September quarter and the first nine months. Subtracting the quarter from the nine-month total also gives a first-half comparison. Figures below are reported US dollars, with growth calculated from those amounts. Amazon’s September 2026 10-Q
| Advertising revenue | 2025 | 2026 | Reported growth |
|---|---|---|---|
| First six months, calculated | $29.615bn | $37.052bn | 25.1% |
| July–September | $17.703bn | $19.637bn | 10.9% |
| January–September | $47.318bn | $56.689bn | 19.8% |
The nine-month window includes Prime Day in both years. Advertising revenue grew by $9.371 billion over that window. This makes approximately 20% reported growth a more useful starting point for discussing the year so far than applying the third-quarter rate to every future quarter.
The comparison still contains currency effects and changes in advertising mix, pricing and demand. The filing also groups sponsored ads, display and video advertising together. The table cannot isolate the amount of advertising revenue shifted by Prime Day.
What management’s explanation leaves open
Amazon attributed the third-quarter advertising comparison primarily to Prime Day timing and some other timing factors. It expects advertising revenue to grow in the high teens in Q4. That is management’s outlook for an unreported quarter. The release’s preceding 12% Q3 figure explicitly excludes currency effects, while the outlook sentence does not specify that adjustment. Keep that distinction visible when comparing the eventual result. Amazon’s Q4 guidance
A rebound would support the timing explanation, but its size matters. A recovery that still leaves full-year growth slowing would call for more conservative forecasts than simply carrying the strong first-half rate forward. Continued weakness would make it harder to treat the third quarter as a calendar anomaly alone.
For valuation, start with the revenue base that spans the promotion in both years, then test several growth assumptions. Separately assess what portion of incremental advertising sales becomes profit. Amazon’s revenue disclosure supplies no standalone advertising operating margin, so a revenue-growth estimate cannot by itself establish the value of the business.
Follow the Amazon stock profile and our analysis of AWS profit and Amazon’s investment bill for the broader financial picture.
Archival shopping photograph by Matthew Paul Argall, 15 February 2012. The image and its crops retain the CC BY-SA 3.0 licence.