SpaceX Earnings: AI Drives Revenue Surge, but Cash Spending Remains Huge
SpaceX returned to profit as its Super Intelligence business surged. Its SEC earnings release also shows why capital spending and the quality of profit deserve attention.
 Wealth / The Compound journal
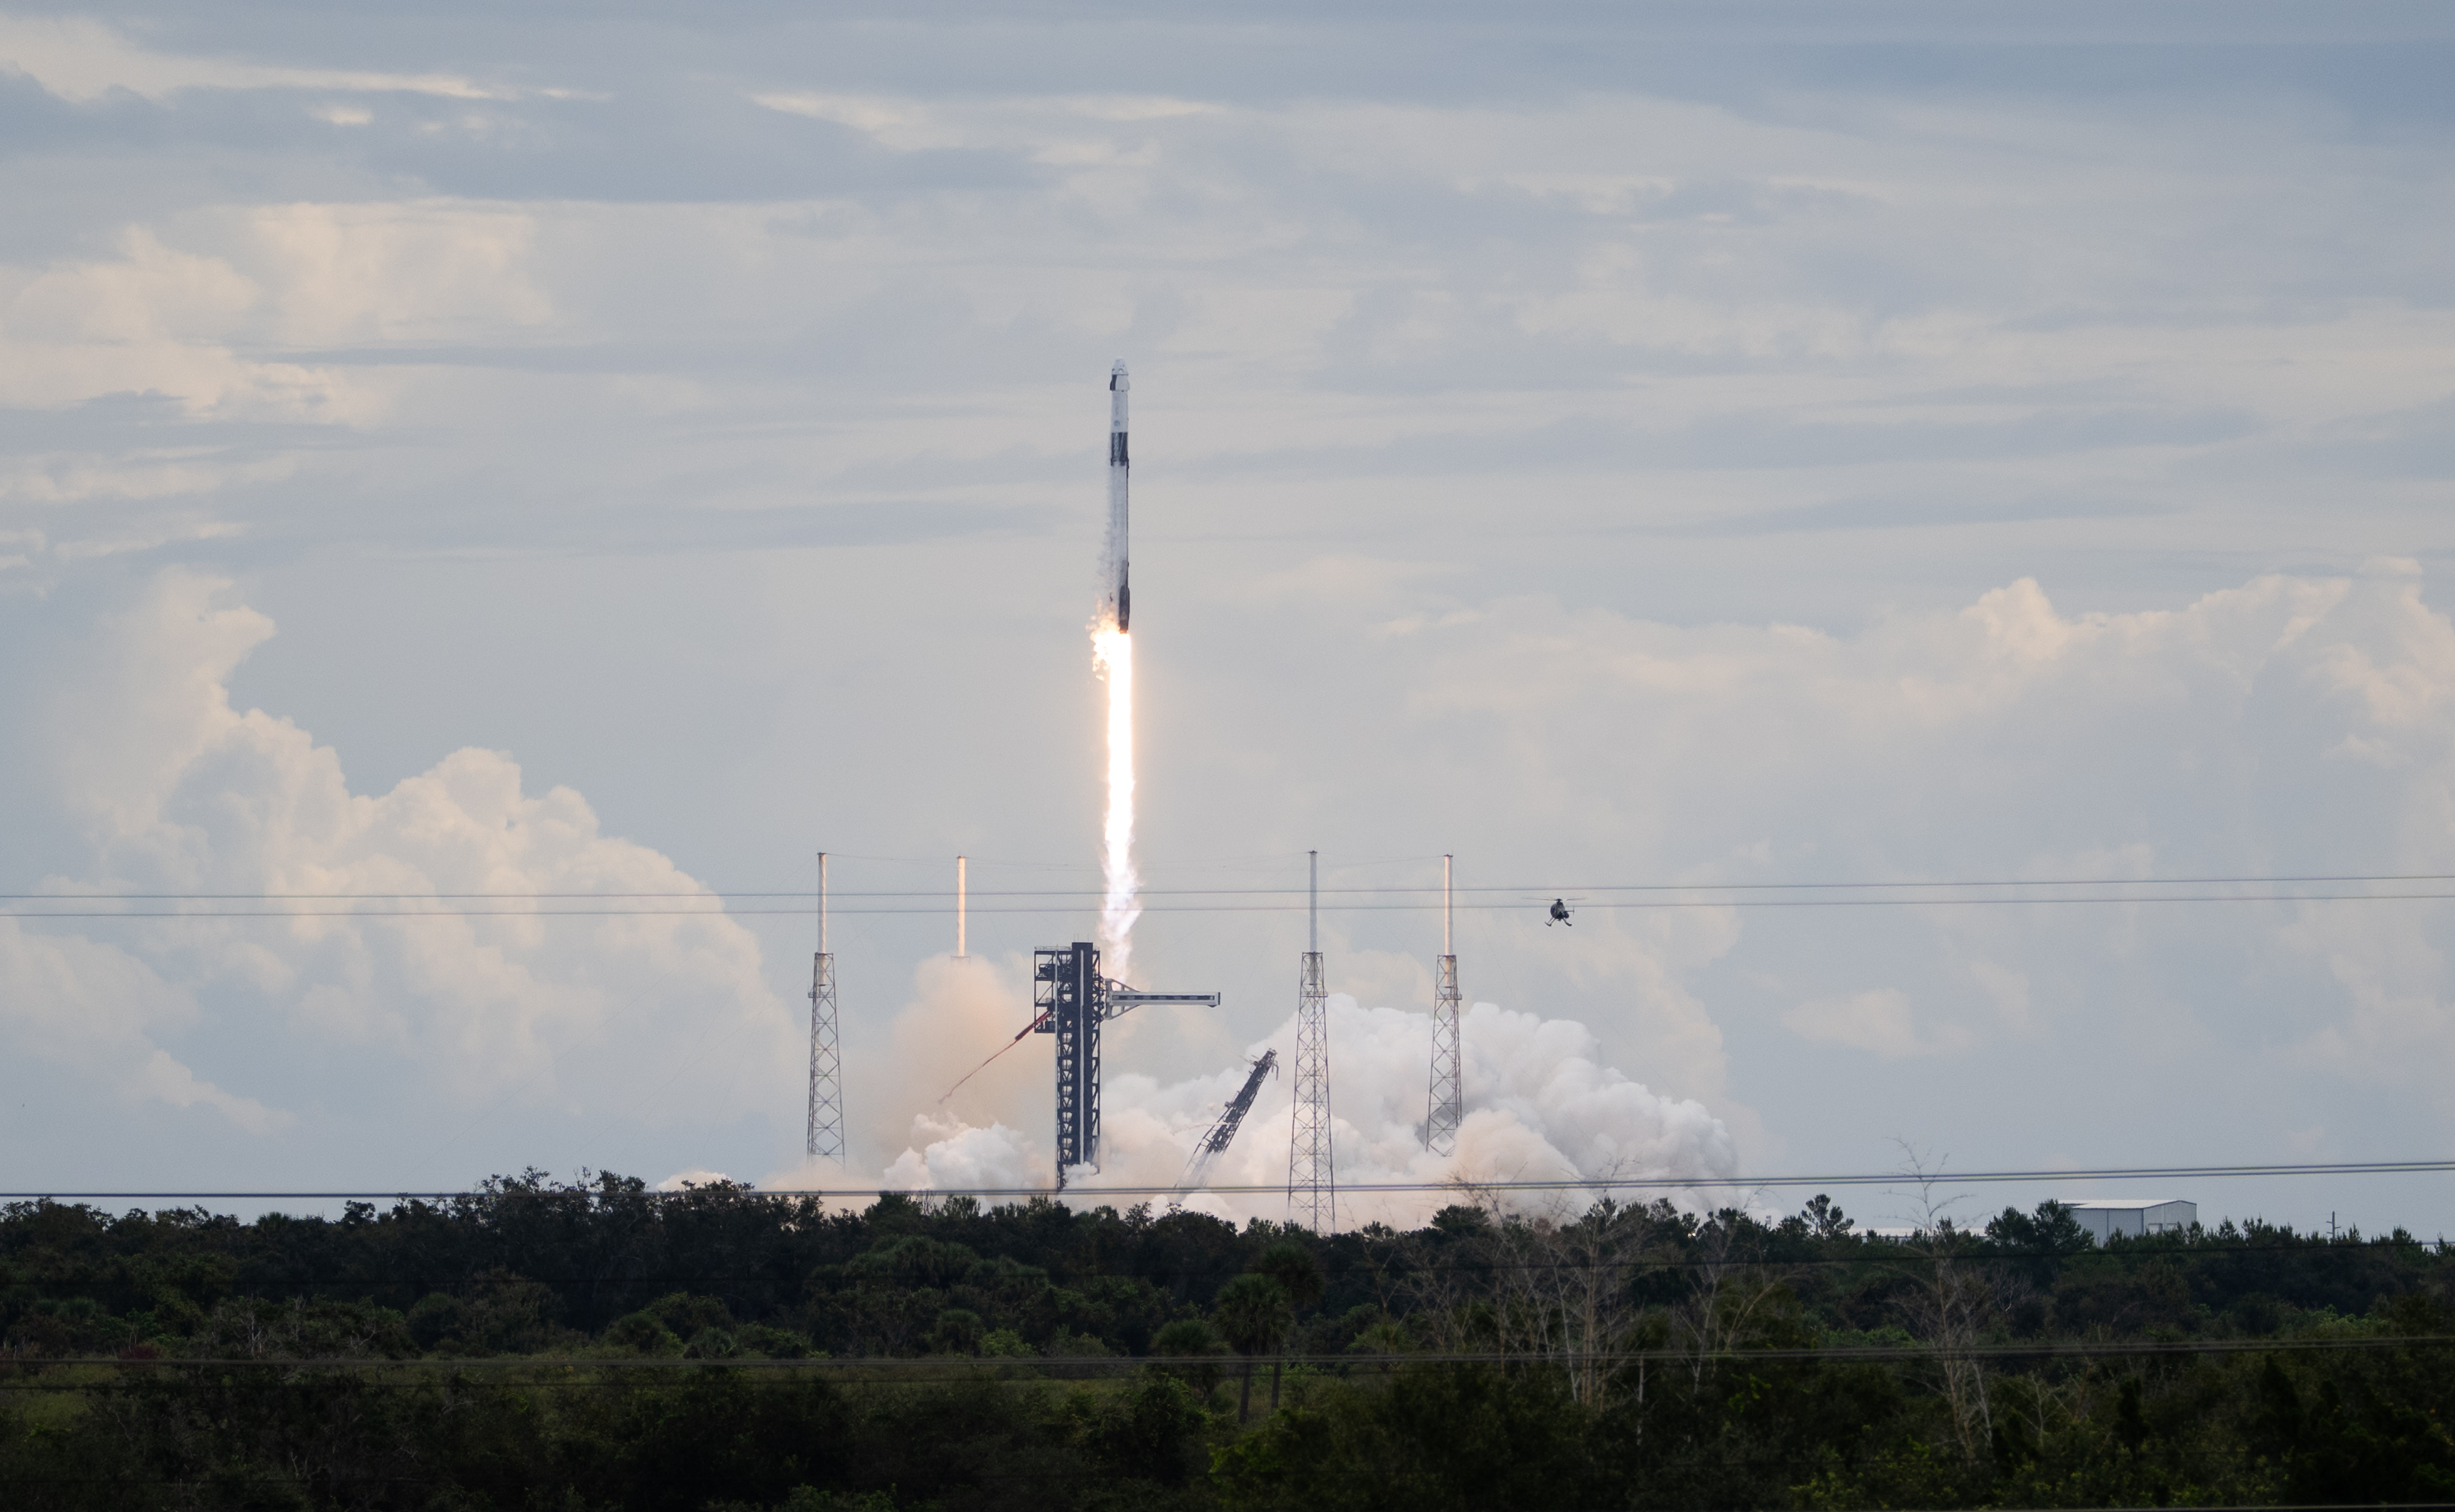
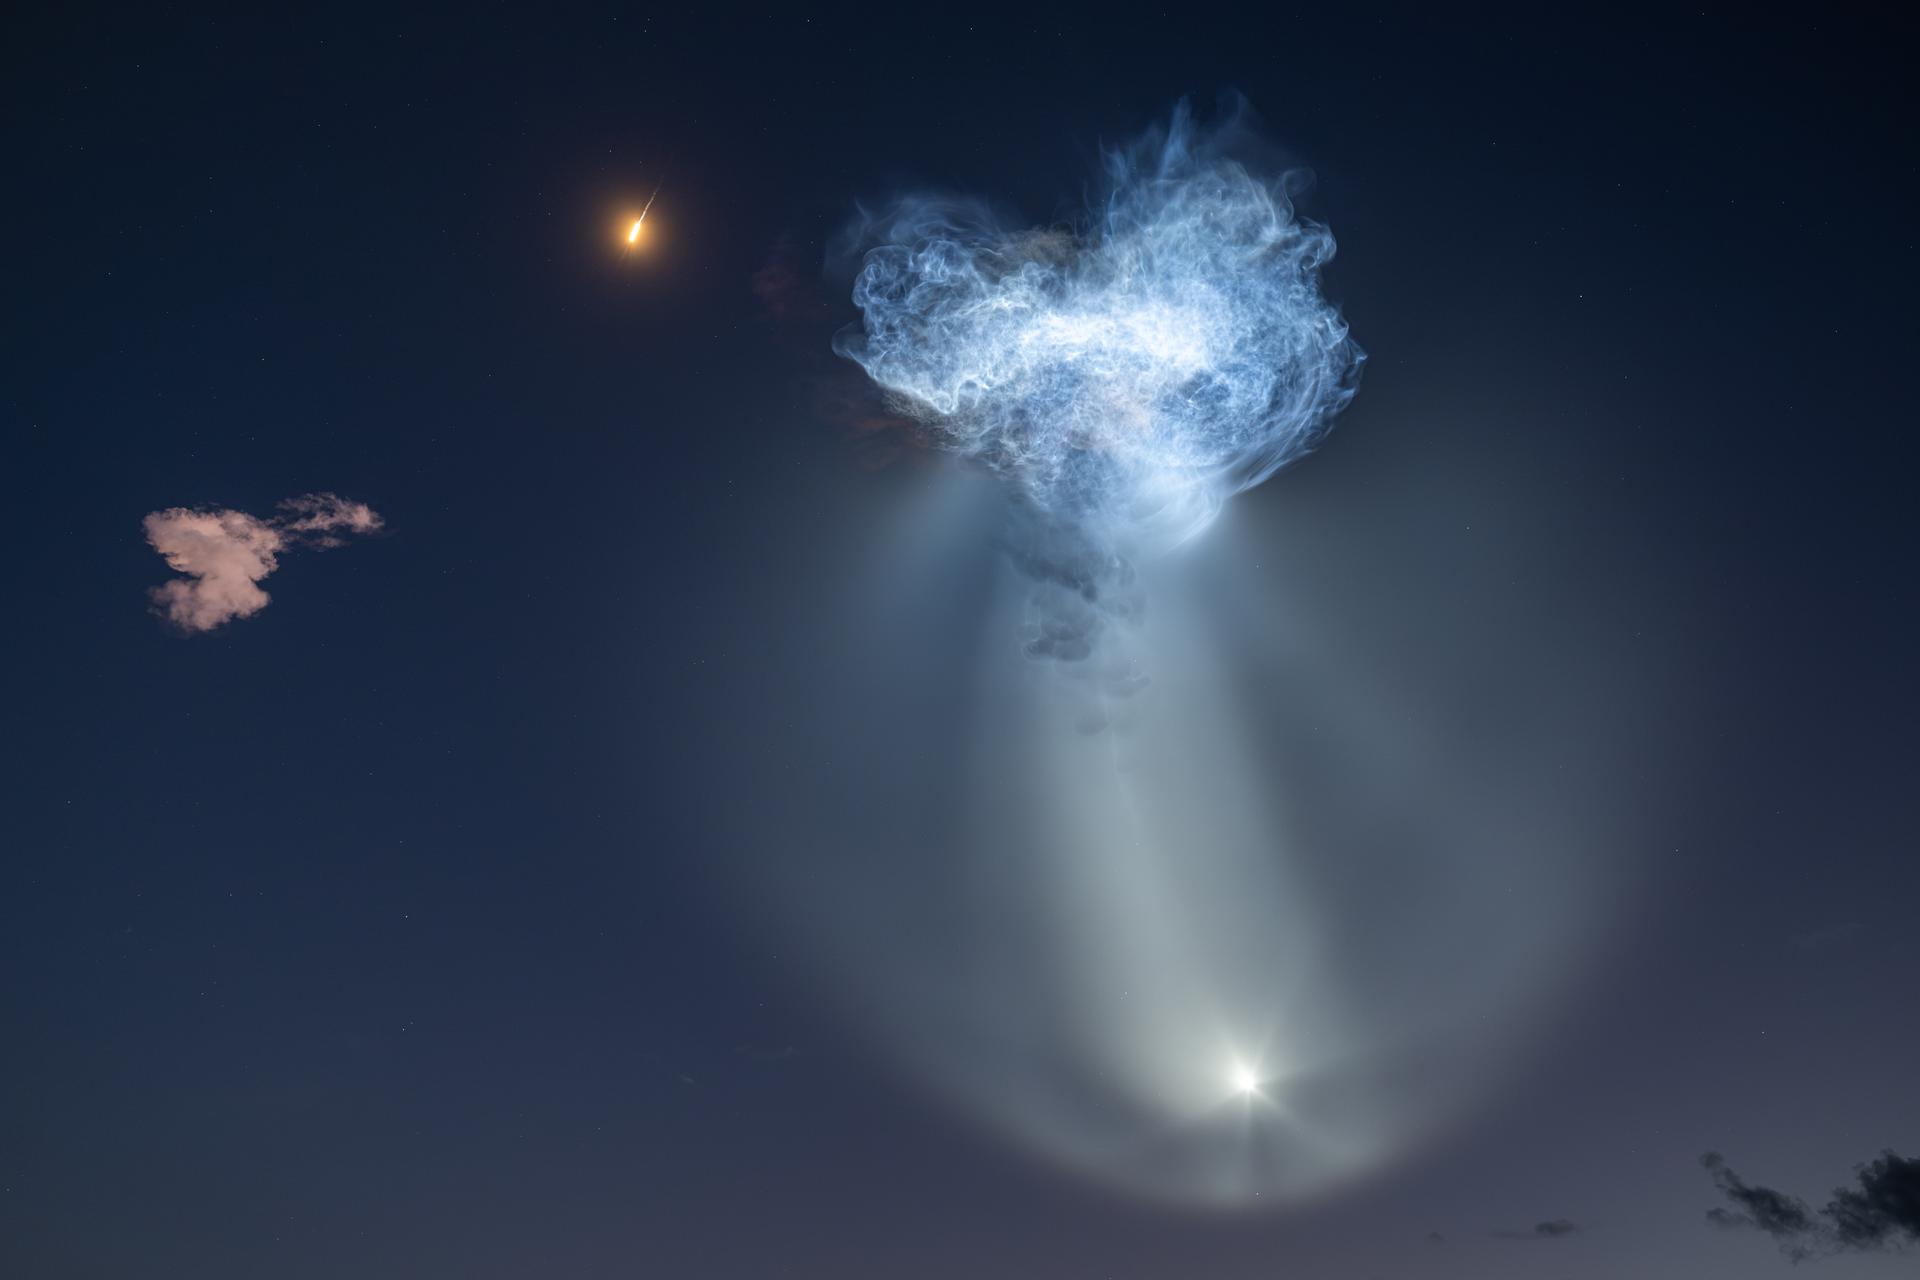
Photo: NASA / John Kraus — 13 October 2026; editorial reuse under NASA Media Usage Guidelines · Illustrative image.
SpaceX has delivered a sharp rise in revenue and returned to quarterly profit. The harder question for investors is how quickly that growth can fund the infrastructure being built to support it.
The company’s earnings release, furnished as Exhibit 99.1 to its 20 October 2026 SEC Form 8-K, reports $14.575 billion of revenue, $4.404 billion of net income and $0.35 diluted earnings per share for the quarter ended 30 September 2026.
Those are reported results, not analyst forecasts. Revenue rose about 161% year-on-year and 87% from the June quarter. Yet quarterly capital expenditure reached $19.593 billion, exceeding quarterly revenue.
The two facts can coexist: SpaceX’s operations improved substantially, while its expansion continued to require enormous amounts of capital. This analysis uses the earnings release, including its unaudited financial statements, rather than an earnings-call transcript or a newly filed Q3 Form 10-Q.
The reported numbers
All dollar figures below are billions, except earnings per share. Q3 ended 30 September 2026; Q2 ended 30 June 2026. Prior-year comparisons refer to the quarter ended 30 September 2025.
| Metric | Q3 2026 | Q2 2026 | Q3 2025 |
|---|---|---|---|
| Revenue | $14.575bn | $7.814bn | $5.576bn |
| Operating profit / loss | $2.791bn | −$0.143bn | −$0.273bn |
| Adjusted EBITDA | $8.809bn | $3.538bn | $2.169bn |
| Capital expenditure | $19.593bn | $18.369bn | $6.880bn |
Adjusted EBITDA is a company-defined non-GAAP measure. It should be read alongside operating profit, net income and cash flow, not substituted for them.
The release reports $4.404 billion net income, versus a $1.054 billion loss a year earlier. Diluted EPS was $0.35, versus −$0.36. Changes in the capital structure and weighted-average share count also matter when comparing per-share figures.
For the company page and related coverage, see SpaceX stock research on Compound.
AI is now the largest revenue segment
SpaceX calls its former Artificial Intelligence segment Super Intelligence, or SI, in this release. SI generated $7.560 billion of revenue, up from $2.561 billion in Q2 and $813 million a year earlier.
That is roughly 52% of consolidated quarterly revenue, calculated from the reported figures. SI also moved from a $1.257 billion operating loss in Q2 to $431 million of operating profit in Q3.
The company attributes growth primarily to new cloud-services agreements, the Cursor acquisition and increased adoption of Grok. Cursor contributed $608 million of revenue between its 14 August acquisition date and quarter end. Investors should therefore distinguish acquired revenue from growth generated by the pre-existing business.
Nameplate compute capacity reached 1.7 gigawatts, compared with 1.4 GW in June. Nameplate capacity describes infrastructure capacity; it does not establish how much is utilised, billed or converted into cash.
The investment question is whether new capacity continues to produce attractive returns after depreciation, electricity, staffing and financing costs. Rapid revenue growth is encouraging, but it is only part of that calculation.
Starlink remains the main source of operating profit
Connectivity revenue reached $5.248 billion, up 69% year-on-year. The segment produced $2.367 billion of operating profit, approximately 85% of consolidated operating profit this quarter.
Starlink consumer subscribers increased from 12.0 million to 13.6 million during the quarter. Monthly consumer average revenue per user rose from $66 to $69, although it remained below the $83 reported a year earlier.
Enterprise and government revenue grew to $2.127 billion, from $1.111 billion a year earlier. That is a useful reminder that the Connectivity business extends beyond household subscriptions.
The release clarifies that its consumer subscriber metric excludes managed enterprise and government customers in categories including aviation and maritime. The 13.6 million figure should not be presented as a count of every Starlink customer relationship.
Our reading: Connectivity provides a substantial operating-profit base while SI scales. Investors still need to monitor subscriber economics, the cost of constellation expansion and whether service quality keeps pace with growth.
Why $4.4 billion of profit needs unpacking
Reported net income was higher than operating profit. The income statement explains the bridge:
| Q3 profit bridge | Amount |
|---|---|
| Operating profit | $2.791bn |
| Interest expense | −$0.675bn |
| Interest income | +$0.873bn |
| Other income, net | +$1.025bn |
| Pre-tax profit | $4.014bn |
| Income-tax benefit | +$0.390bn |
| Net income | $4.404bn |
The operating turnaround is real in the reported accounts. However, extrapolating the entire net-profit figure as recurring operating earning power would overlook the contribution from other income and the tax benefit.
There is also a large gap between SI’s $431 million operating profit and $4.953 billion adjusted EBITDA. Its reconciliation adds back depreciation and amortisation, ordinary share-based compensation and $1.217 billion of acquisition-related share-based compensation, among other items.
These adjustments can help explain period-to-period changes. They do not make asset replacement costs or shareholder dilution economically irrelevant.
Capital spending is the central funding question
Quarterly capex of $19.593 billion included $16.444 billion in SI, about 84% of the total. That concentration shows where the company is directing most of its expansion capital.
For the first nine months of 2026, the cash-flow statement reports:
- $13.097 billion of cash generated by operating activities.
- $48.069 billion of purchases of property, plant and equipment.
- $1.372 billion of proceeds from product rebates, reported separately within investing cash flows.
Subtracting property and equipment purchases from operating cash flow gives a $34.972 billion nine-month shortfall. This is a simple analytical calculation, not a company-reported free-cash-flow measure. It excludes the separately reported rebates, capitalised interest and other investing items. It is also a nine-month figure, not a quarterly cash-burn figure.
SpaceX reported $51.294 billion in cash and equivalents plus $38.561 billion in marketable securities at quarter end. Debt and finance leases totalled $38.844 billion, combining current and long-term balances.
That liquidity provides substantial financial capacity, but the relevant question is how long it supports planned spending and commitments. A large cash balance and a profitable quarter do not, by themselves, establish that expansion is self-funding.
Starship advances, while the Space segment remains near break-even
Space segment revenue rose to $1.767 billion, from $962 million in Q2, and its operating loss narrowed to $7 million.
SpaceX says Starship Flight 14 delivered 26 Starlink V3 satellites, its first revenue-generating Starship mission. The company describes the downlink capacity added as approximately ten times that of a Falcon 9 Starlink launch. That is a company claim about deployed capacity, not a statement that launch revenue or profit increased tenfold.
Total launches were 35, down from 38 in Q2 and 44 a year earlier. Revenue and launch count need not move together because customer mix and development revenue differ. Investors should follow both technical progress and the cost of achieving reliable, repeatable operations.
What investors should watch next
The results strengthen the case that SI revenue is scaling and Connectivity is producing substantial operating earnings. They also make the financing and accounting questions more consequential.
The next assessment should focus on cash collection from new contracts, recurring profit after investment costs, SI capacity utilisation, Starlink unit economics and capital-spending commitments. Acquisition-related revenue and compensation deserve separate attention when judging organic growth and dilution.
A Tesla merger remains a separate investment question. This earnings release does not announce one; our Tesla–SpaceX merger analysis discusses that scenario and its shareholder implications.
SpaceX’s Q3 result is a significant operating improvement. Whether it becomes an attractive investment return depends on the price paid for the shares and the returns ultimately earned on the capital now being deployed.