Monster Sold More Cases but Earned Less per Case. Can Volume Carry the Margin?
Monster Beverage’s case volume grew faster than revenue while average sales per case and margins fell. International mix and marketing are the next test.
 Wealth / The Compound journal
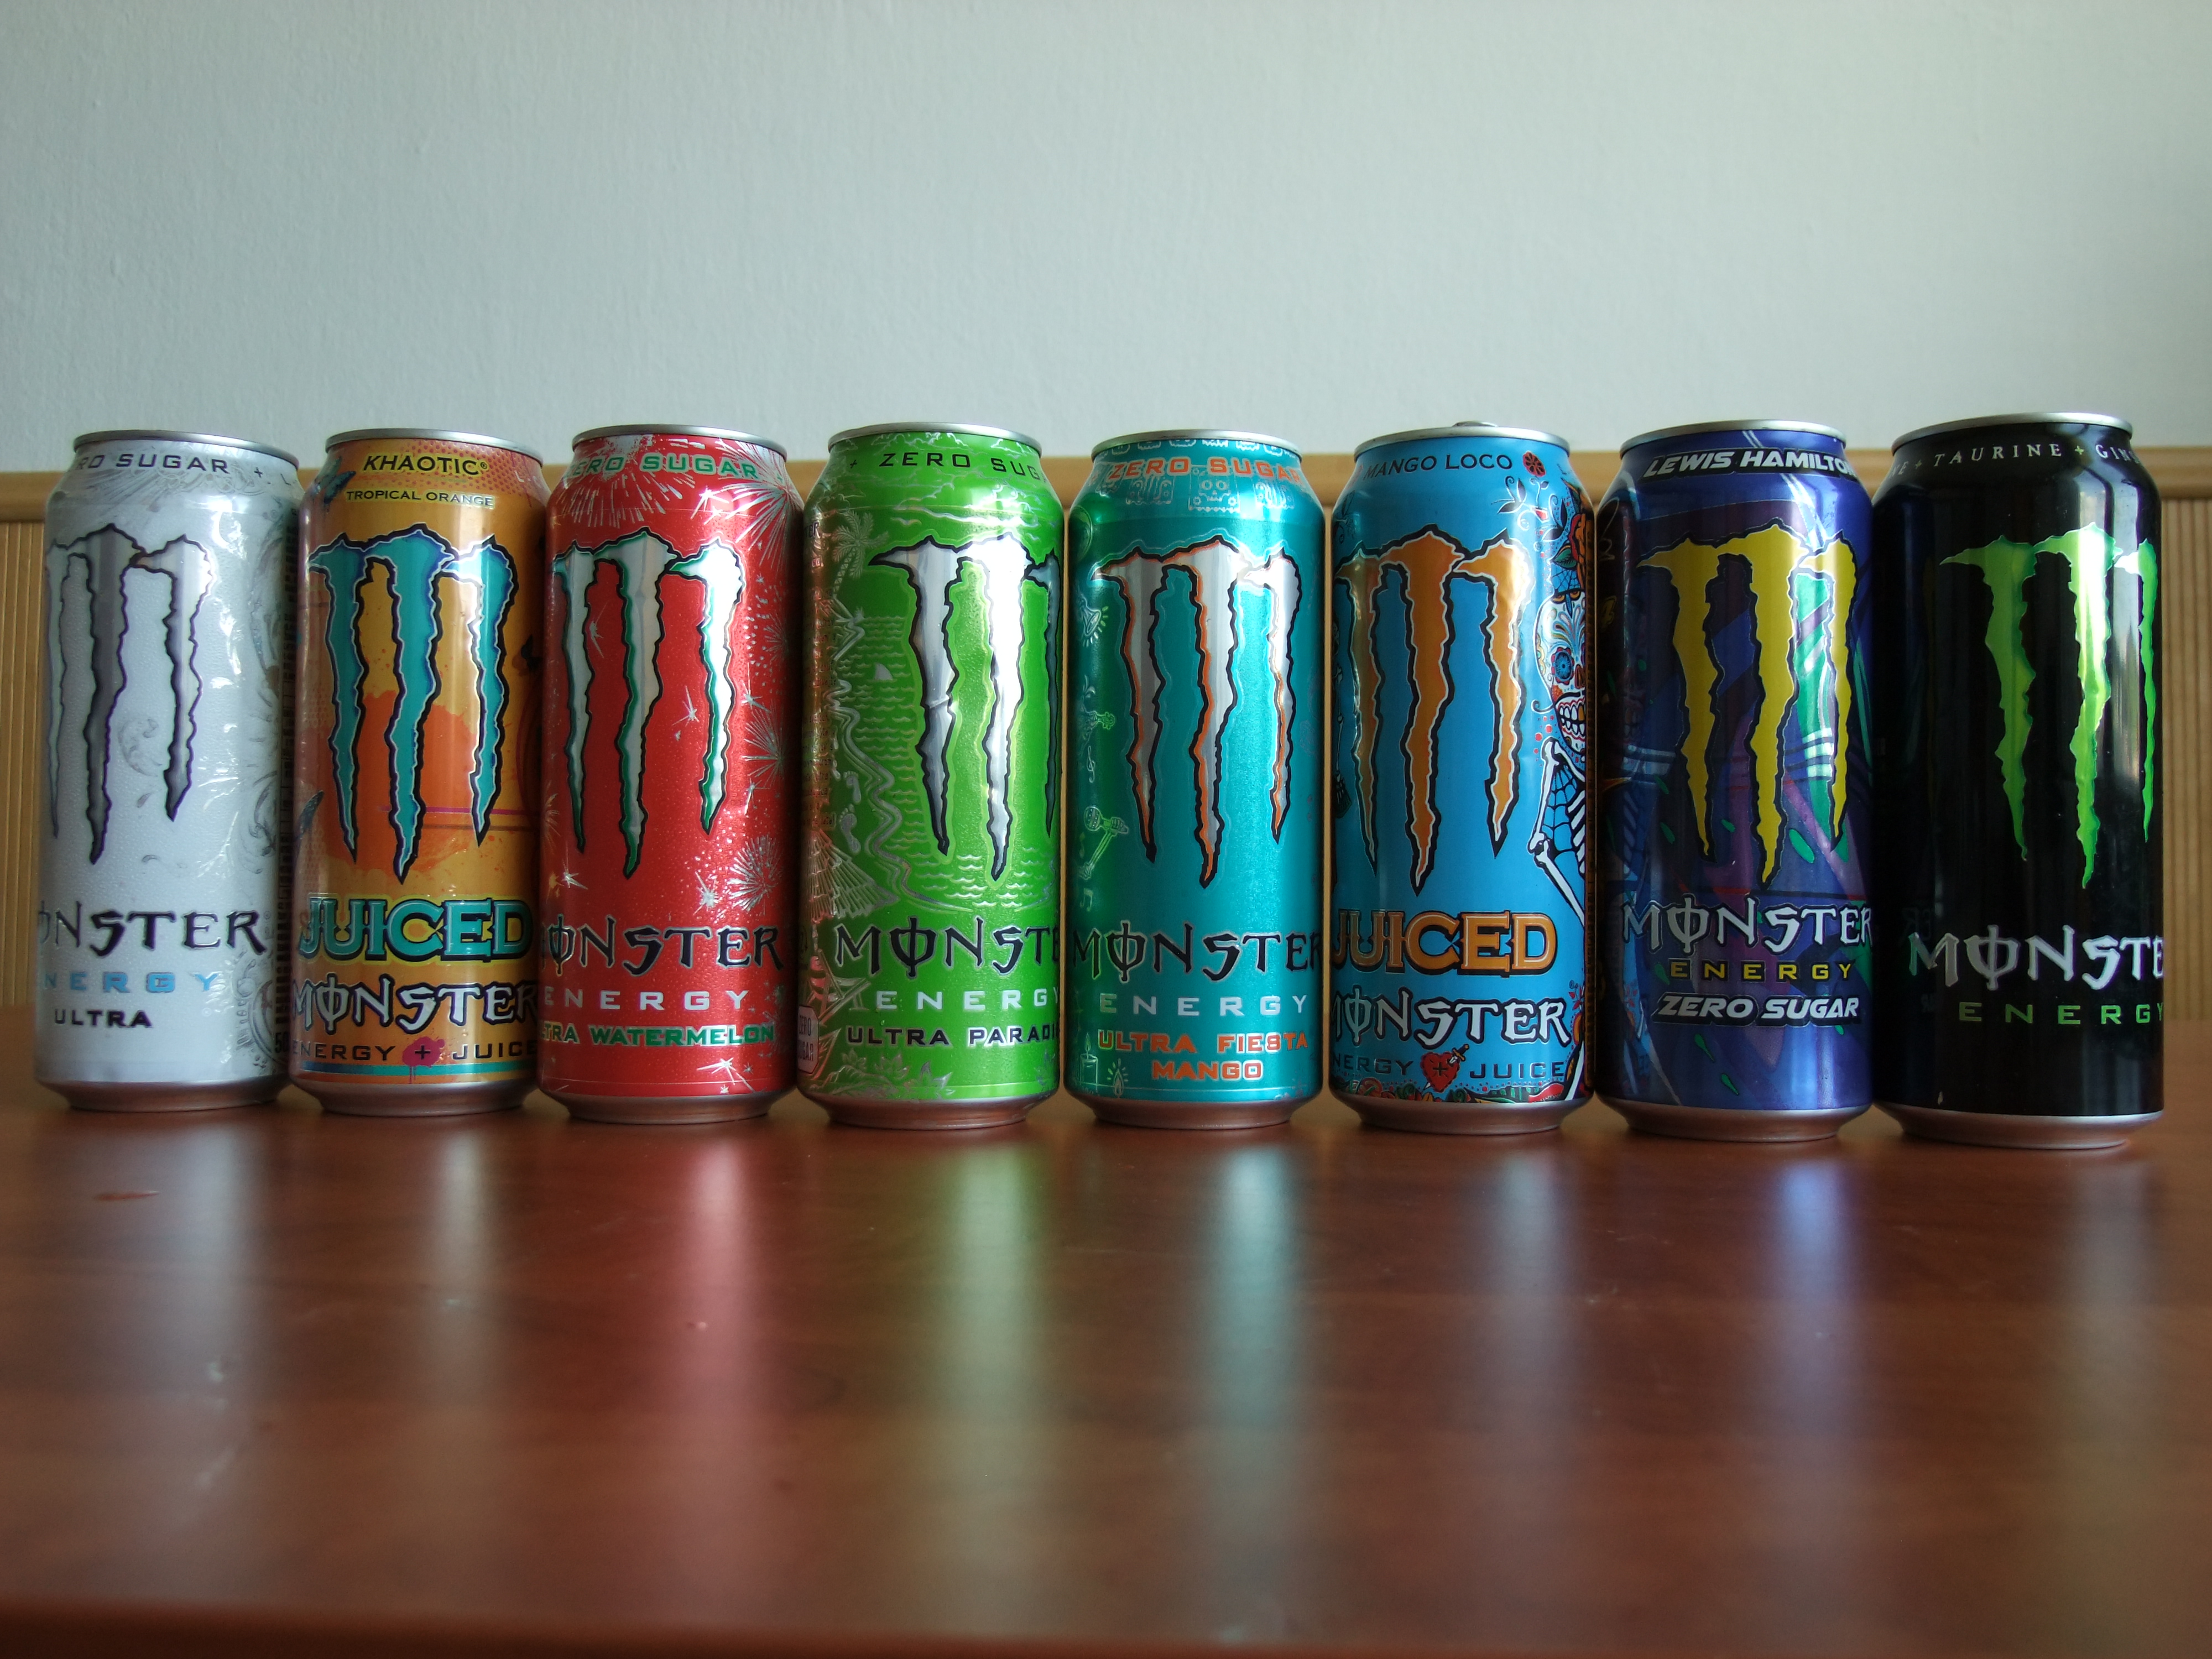
Photo: Oto Zapletal / Wikimedia Commons, CC BY-SA 4.0. Archival photograph taken 8 May 2023; cropped for publication. · Illustrative image.
Monster Beverage is selling substantially more energy drinks, but the revenue earned per standard case has slipped and costs are absorbing more of the growth. The investment question is whether volume can keep outrunning that pressure.
For Q3 2026, Monster reported $2.563 billion of net sales, up 16.7%. Energy-drink case volume increased to 304.9 million 192-ounce equivalents from 258.4 million, a rise of about 18.0%.
Average net sales per case fell to $8.30 from $8.35. Gross margin declined by one percentage point and operating income grew only 6.4%. That is still profitable growth, but it is less powerful than the top-line number alone suggests.
For the maintained financial record, see Monster Beverage’s stock profile. This analysis asks whether global volume expansion is building a stronger economic franchise or merely asking the company to work harder for each dollar of profit.
Volume did more of the work than price
The 18.0% increase in standardised case volume exceeded reported revenue growth of 16.7%. Average sales per case declined about 0.6%, based on the reported $8.30 and $8.35 figures.
The measure excludes Alcohol Brands and Other segment sales, so it is not a perfect bridge to consolidated revenue. It is also expressed in 192-ounce equivalents, not a literal count of cans. Nevertheless, the direction is useful: physical energy-drink growth was stronger than monetisation per equivalent case.
That is not automatically negative. Lower revenue per case can reflect geographic and product mix rather than discounting. A case sold in a newer international market may carry a different price, package mix and route-to-market than one sold in the United States.
Monster’s pricing actions helped the quarter, according to management. They were not enough to offset all the mix and cost effects. Investors therefore need to separate brand demand from the economics of serving that demand.
International expansion changes the mix
Sales outside the United States increased 28.1% to $1.20 billion, reaching approximately 47% of total sales, compared with 43% a year earlier. Currency contributed $8.1 million to group sales; foreign-currency-adjusted growth was 16.3%, only slightly below the reported rate.
International growth is widening the addressable market and reducing reliance on one country. It also changes pricing, freight, packaging and distribution economics. Management specifically identified geographical sales mix as one reason gross margin fell.
The core Monster Energy Drinks segment increased sales 17.1% to $2.373 billion. Strategic Brands grew 19.8% to $156.4 million. Alcohol Brands moved the other way, falling 13.6% to $28.5 million.
Energy drinks therefore remain the economic centre of the company. The smaller alcohol operation can create noise and investment requirements, but it did not drive the quarter’s consolidated growth. Excluding Alcohol Brands, sales rose 17.1%, a company-defined non-GAAP comparison.
Gross profit grew, but margins narrowed
Gross profit increased 14.4% to $1.401 billion, slower than sales, and gross margin declined to 54.7% from 55.7%. Monster attributed the compression mainly to higher aluminium-can costs, geographic mix and freight-in costs, partly offset by pricing.
Distribution expense rose to $116.3 million from $82.6 million and increased to 4.5% of sales from 3.8%. The company pointed to freight and fuel. Selling expense climbed to $260.1 million from $214.6 million and increased to 10.1% of sales, with management citing social, digital, media, sponsorship and endorsement spending.
Those marketing costs can support future household penetration and new-product launches. They are still current expenses, and the return should eventually appear in repeat volume, pricing resilience or both.
Operating expense rose 24.2% to $682.0 million, faster than revenue. The total included a $19.9 million property-and-equipment impairment and $14.7 million of digital-transformation costs. Adjusted operating expense, which removes selected items and is non-GAAP, rose 24.4% to $644.4 million.
GAAP operating income increased 6.4% to $718.7 million. The calculated operating margin was about 28.0%, down from 30.7%. Net income rose 8.4% to $568.4 million, while net margin fell to 22.2% from 23.9%.
The outcome is straightforward: demand growth was strong enough to lift absolute profit, but not enough to prevent margin compression.
The balance sheet provides room, not proof
Monster held $2.148 billion of cash and $1.556 billion of short-term investments at September, a combined $3.704 billion. It spent about $100 million repurchasing 2.3 million shares during the quarter at an average $43.87 per share, with $800 million of authorisation remaining on 4 November.
Repurchases should be assessed alongside the share count. Split-adjusted diluted weighted-average shares were 1.980 billion, up from 1.970 billion a year earlier. A buyback can offset employee issuance without materially shrinking each owner’s denominator.
The balance sheet gives Monster flexibility to invest through freight and input-cost volatility. It does not establish that every international launch, marketing campaign or repurchase earns an attractive return.
What would confirm the thesis?
The strongest evidence would be case growth remaining broad while average net sales per case stabilises, gross margin recovers and distribution expense stops rising faster than sales. International volume should translate into operating income, not merely a larger revenue base. Marketing investment should support repeat demand without requiring a permanently higher expense ratio.
The counter-case is that international mix, aluminium, freight and promotion keep compressing unit economics. Volume could remain impressive while profit growth slows, leaving the company more exposed if demand normalises.
Monster’s brand portfolio is generating real global demand. The next test is whether that demand can produce stronger economics per case—not just more cases.
Explore Compound’s earnings hub and our guide to investment diversification.
Reported figures are in US dollars and relate to Q3 2026 unless stated otherwise. Facts come from Monster Beverage’s official results release and SEC filings; calculations and interpretation are Compound’s. Case volume uses 192-ounce equivalents and average sales per case excludes Alcohol Brands and Other. General information, not personal investment advice.
Cover: Oto Zapletal, Wikimedia Commons, under CC BY-SA 4.0. Archival photograph taken 8 May 2023; cropped for publication and not presented as the current full product range.