Lam Research Earnings: Strong Growth Meets an Even Higher Bar
Lam Research fiscal Q1 2027 earnings: $8.22bn revenue, stronger margins and a sharp share-price fall. What the SEC results say about expectations.
 Wealth / The Compound journal
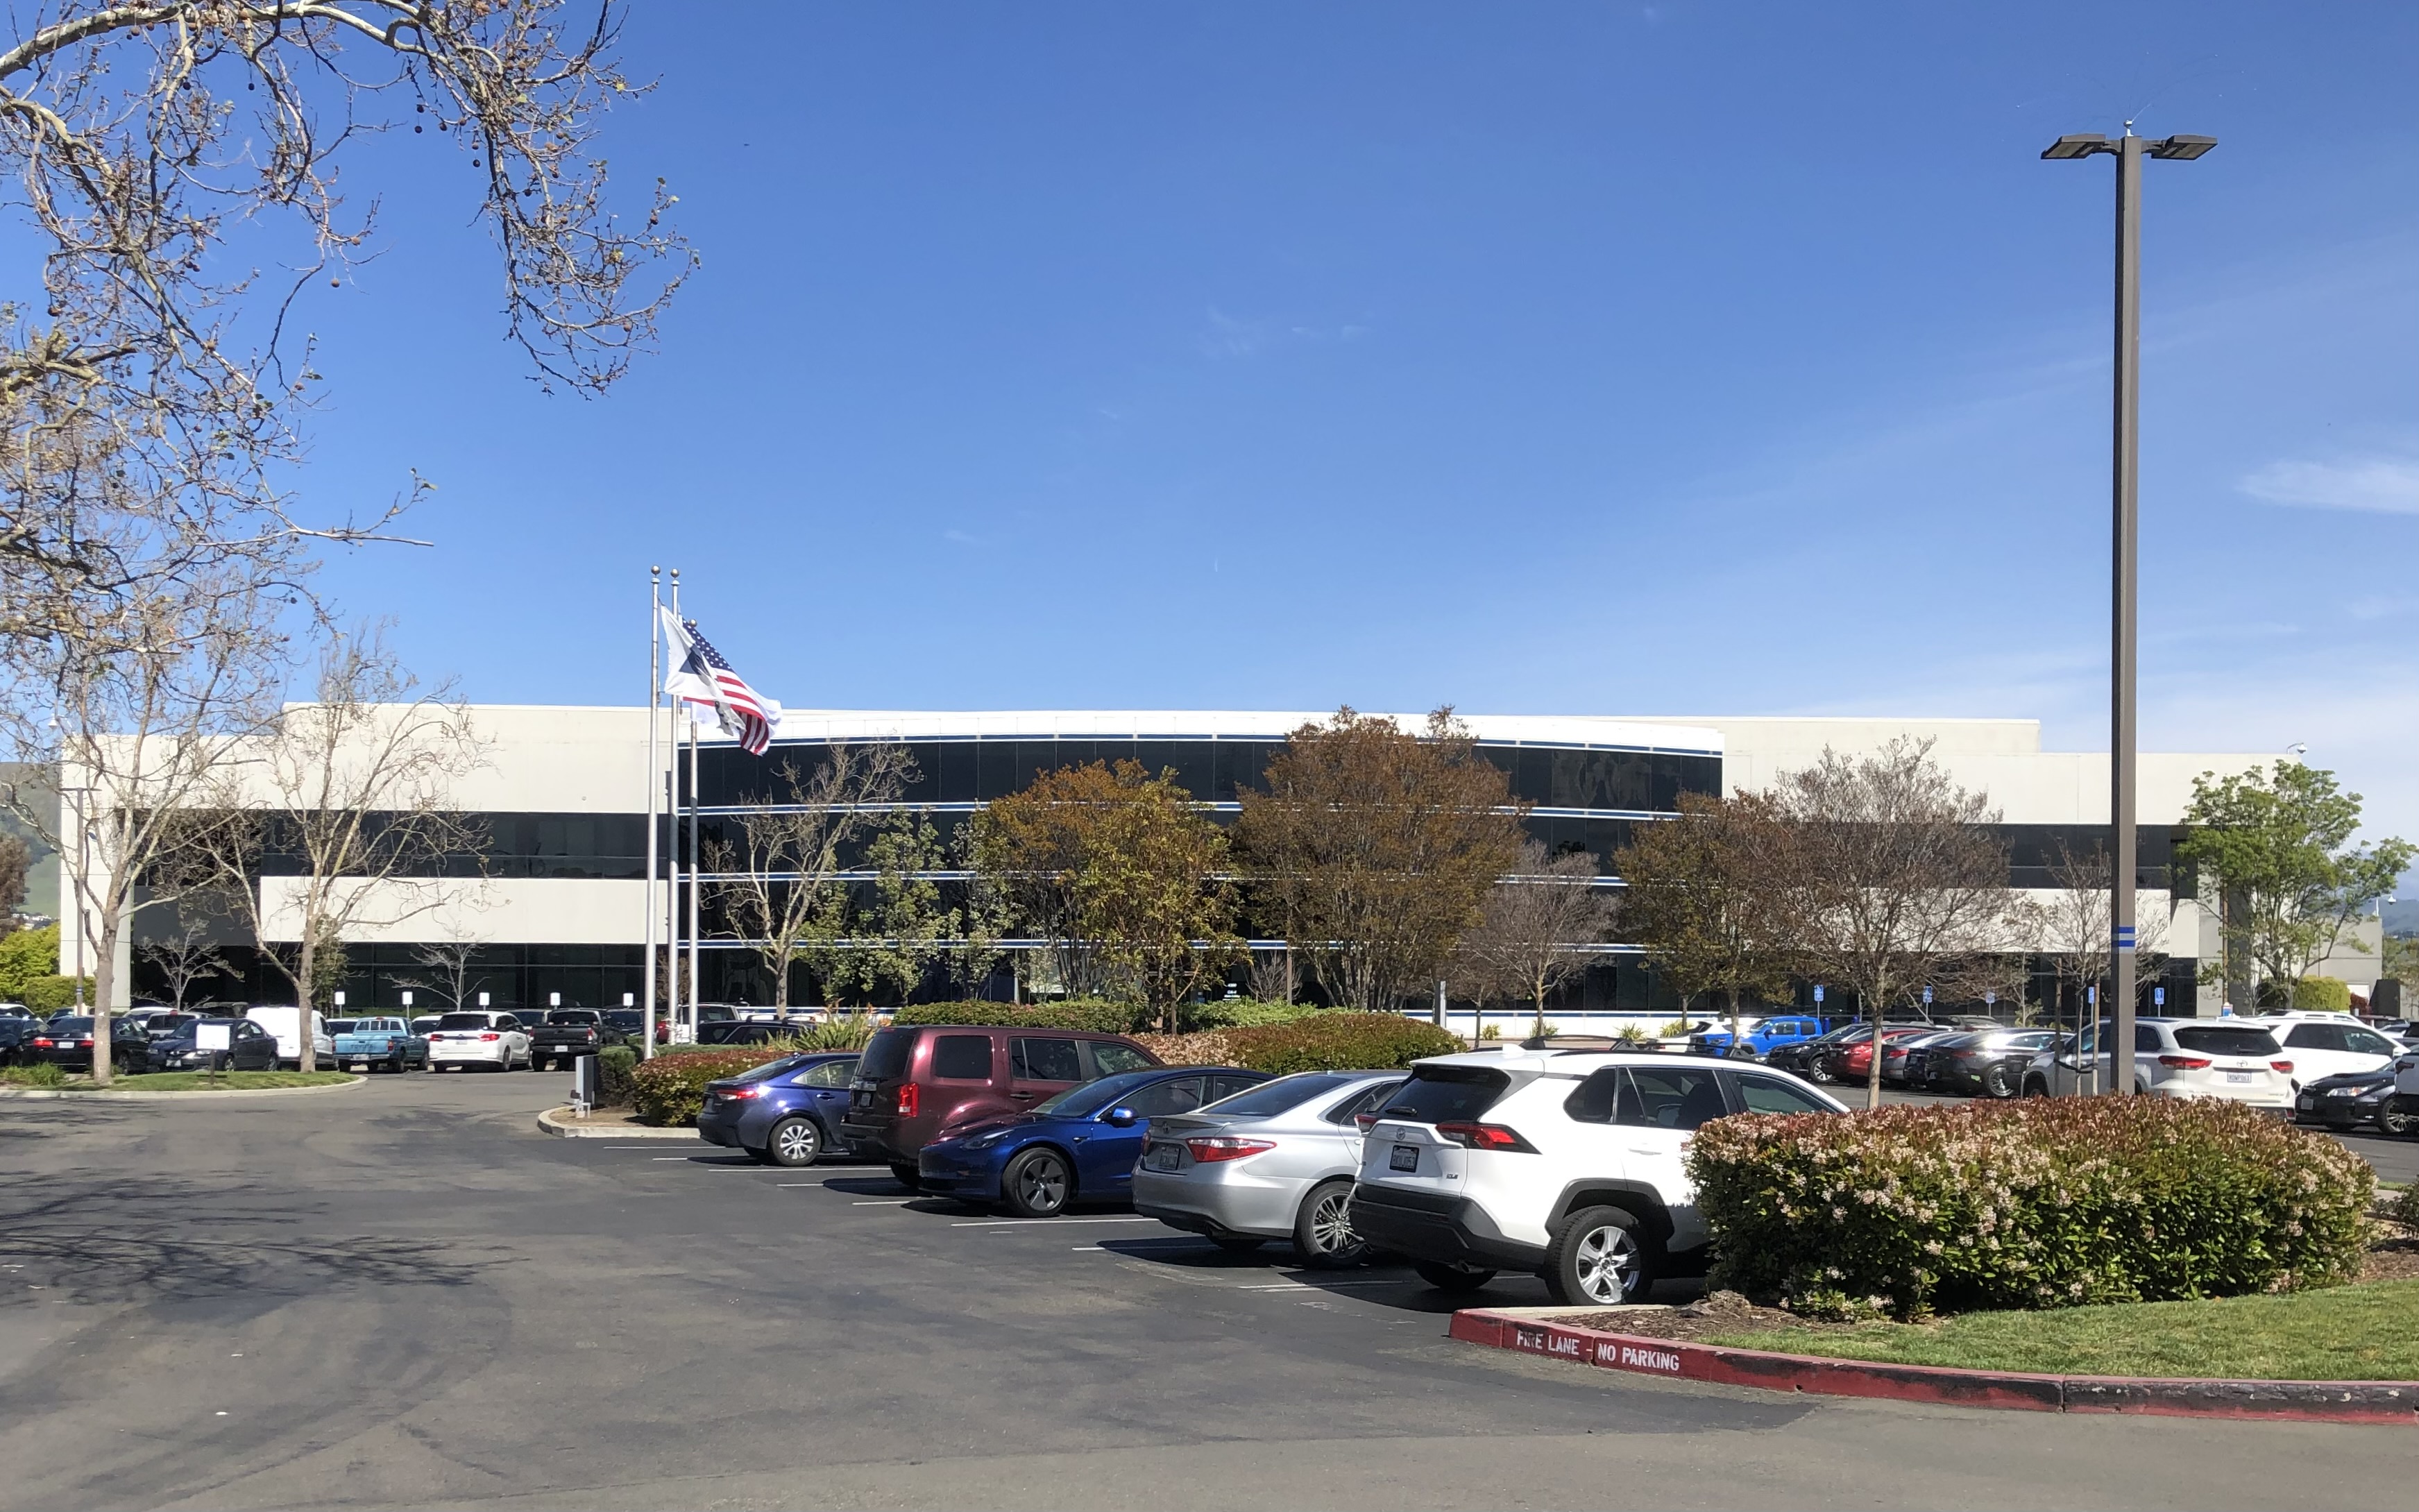
Photo: Olaf2 / Wikimedia Commons — 18 April 2023, archival; CC BY-SA 4.0 · Illustrative image.
Lam Research’s results illustrate a recurring problem for investors in fast-growing businesses: the company can perform well while the shares perform badly.
The chip-equipment maker reported on 21 October 2026, covering its fiscal first quarter ended 27 September 2026. Shares fell 11.8% on 22 October, according to Associated Press coverage of the broader technology sell-off. That market reaction is separate from the operating figures below.
A strong quarter on its own terms
| Measure | September 2026 quarter | June 2026 quarter |
|---|---|---|
| Revenue | $8.219bn | $6.722bn |
| GAAP gross margin | 52.3% | 51.7% |
| GAAP operating margin | 40.0% | 37.4% |
| GAAP diluted EPS | $2.19 | $1.81 |
| Adjusted diluted EPS | $2.20 | $1.82 |
Source: SEC earnings release. These are sequential comparisons. Adjusted EPS is a non-GAAP measure.
Revenue increased 22% sequentially. The widening operating margin means profit grew faster than the cost base. The small gap between reported and adjusted EPS also makes this quarter easier to interpret than a result dominated by large exclusions.
Strong operating results and an attractive share price are different propositions. The first concerns what the business delivered. The second depends on what buyers had already paid to anticipate it.
The next-quarter hurdle
Management’s December-quarter revenue forecast is $8.6bn, plus or minus $400m, with adjusted EPS of $2.33, plus or minus $0.15. The revenue midpoint is about 4.6% above the September quarter, calculated by Compound.
That is additional growth, but a smaller sequential increase than the quarter just reported. It does not establish that demand is collapsing. Nor should investors assume the previous acceleration can continue indefinitely.
A share-price fall cannot identify one precise cause by itself. The wider technology sell-off matters too. Our interpretation is that these results are best read as a test of expectations: how much future expansion was already embedded in the valuation, and how much room remains for surprises?
Follow the equipment cycle and the cash
The 10-Q records $5.733bn of systems revenue, compared with $2.487bn of customer support-related revenue and other sales. Systems rose sharply from June, while support-related revenue was nearly flat sequentially.
That distinction matters because an installed equipment base does not eliminate the cycle in new equipment purchases. Support-related revenue also includes upgrades and non-leading-edge equipment, so it should not all be treated as subscription-like recurring income.
Operating cash generation was approximately $3.50bn, against $257.7m of capital expenditure. Subtracting those rounded figures gives roughly $3.24bn before acquisitions and shareholder distributions. This is our simple cash-after-capex calculation, not a separate company guidance measure.
China accounted for 35% of quarterly revenue. The customer geography creates a further question about the durability of sales under changing trade restrictions; it is not evidence that any particular future restriction will occur.
What to watch next
The useful questions are whether new systems demand continues to translate into recognised revenue, whether support sales develop alongside the installed base, and whether favourable margins survive changes in customer and product mix.
For investors, the discipline is to assess those operating trends separately from the multiple paid for them. A business can exceed last year’s performance and still fail to deliver the future that its share price assumes.
Lam’s quarter provides evidence of strong execution. It does not remove the need for a valuation that leaves room for a slower equipment cycle.
Follow Lam Research’s stock page and our Western Digital analysis for another view of the infrastructure spending cycle.
Figures are US dollars. Calculations and editorial interpretation are Compound’s. General information, not personal investment advice.
Photograph: Olaf2, 18 April 2023. Lam Research building in Fremont, California. Original source; CC BY-SA 4.0. Archival photograph, not the earnings announcement. Resized display versions retain the source licence.