ConocoPhillips Returned 45% of Cash Flow. How Durable Is It When Price Does the Work?
ConocoPhillips returned roughly 45% of operating cash flow while realised prices rose and production fell. We examine how durable that payout is across the cycle.
 Wealth / The Compound journal
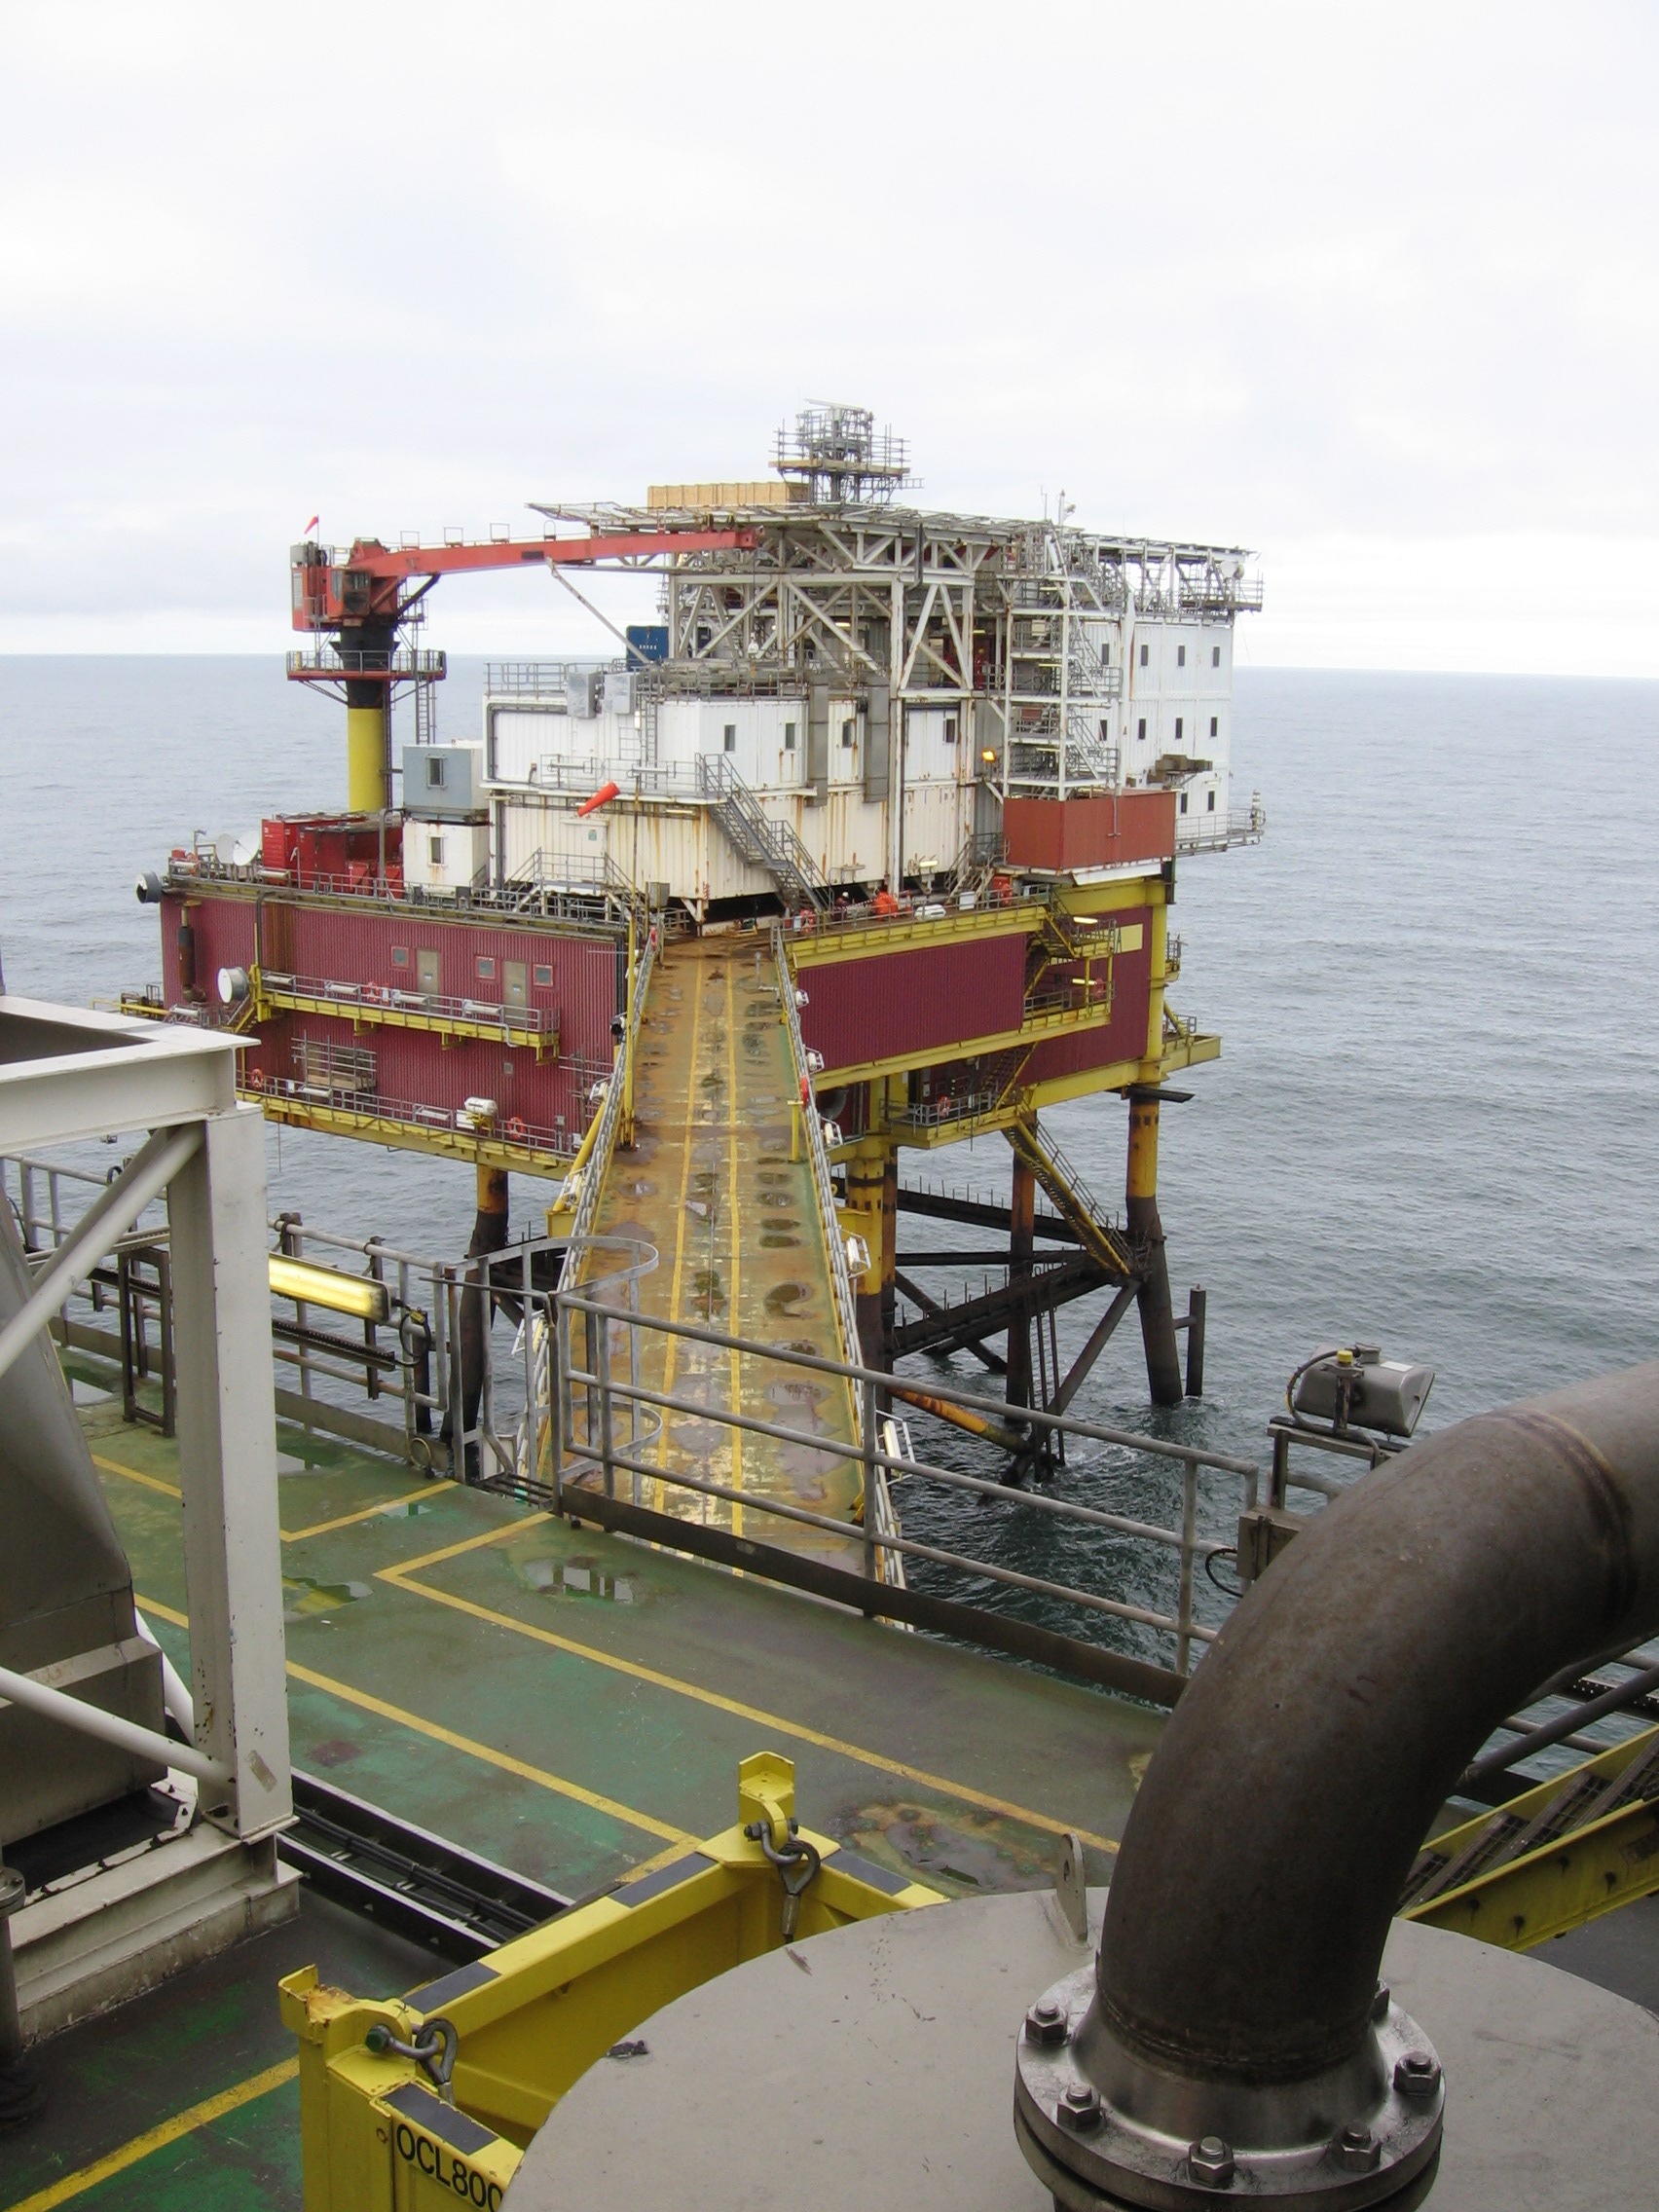
Photo: Alnitak3 / Wikimedia Commons, CC BY-SA 4.0. Archival photograph taken 10 March 2009; cropped for publication. · Illustrative image.
ConocoPhillips is returning nearly half of operating cash flow to shareholders. The important question is whether that policy is supported by durable operating progress or by an oil-and-gas price recovery that can reverse.
The company earned $4.0 billion in the third quarter of 2026, up from $1.7 billion a year earlier. Adjusted earnings rose to $3.9 billion from $2.0 billion. The stronger quarter came with a large price tailwind: ConocoPhillips’ average realised price increased 32% to $61.40 per barrel of oil equivalent.
Production, by contrast, was 2.302 million barrels of oil equivalent per day, down 97,000 on a reported basis. After adjusting for acquisitions and disposals, it fell 40,000, or 2%.
For the maintained financial record, see ConocoPhillips’ stock profile. This analysis asks how much confidence investors should place in the current cash return when commodity prices, rather than production growth, did much of the work.
The payout math works today
ConocoPhillips generated $7.2 billion of cash from operating activities in Q3. It spent $3.1 billion on capital expenditure and investments and distributed $3.4 billion to shareholders: $2.4 billion through repurchases and $1.0 billion through dividends.
Those distributions equalled about 47% of quarterly operating cash flow. Management says the company remains on track to return 45% of full-year operating cash flow. It also raised the quarterly dividend 11% to $0.93 per share.
For the first nine months, the relationship is even clearer. Operating cash flow was $18.92 billion. Share repurchases of $5.41 billion and dividends of $3.06 billion totalled $8.47 billion, or 44.8% of operating cash flow.
This is a transparent capital-allocation rule, but it is not a fixed-dollar promise. When commodity prices rise, operating cash expands and 45% can fund a larger payout. If prices retreat, the same percentage protects the balance sheet by allowing the absolute distribution to fall.
Price, not volume, drove the quarter
The 32% improvement in realised price sits beside lower production. That does not mean the asset base is deteriorating: dispositions, maintenance, timing and project cycles can all affect a quarter. It does mean investors should not extrapolate the earnings increase as though it came from a permanently larger production base.
ConocoPhillips guided fourth-quarter production to 2.32 million–2.36 million barrels of oil equivalent per day and kept its full-year capital and adjusted operating-cost guidance unchanged. Guidance is management’s current expectation, not realised output.
The company also said module fabrication for the Willow development in Alaska was more than 75% complete and continued to target first oil in early 2029. Large projects can support future production, but they consume cash years before generating revenue. Execution, cost inflation and timing therefore matter as much as the stated resource potential.
Cash after investment is substantial—but cyclical
For the first nine months, capital expenditure and investments were $9.11 billion, down from $9.53 billion. Subtracting that amount from operating cash flow leaves $9.82 billion. This is a simple Compound calculation, not ConocoPhillips’ company-defined free-cash-flow measure.
The $8.47 billion returned to shareholders fit inside that amount. That is a strong current coverage position, particularly because total debt edged down to $23.26 billion from $23.44 billion at year-end.
However, disposal proceeds should not be confused with recurring operating cash. ConocoPhillips received $1.76 billion from dispositions during the nine months. That cash can support debt reduction, buybacks or new investment, but selling assets is not the same economic source as producing and selling hydrocarbons.
The balance sheet adds resilience. At 30 September, the company reported total liquidity of roughly $15.4 billion, including $7.8 billion of cash, $2.2 billion of short-term investments and a $5.5 billion revolving facility. Debt was 26% of total capital, down from 27% at year-end.
That buffer matters when price weakens. The best capital-return policies are not judged only in favourable markets; they are judged by whether the company can keep funding competitive projects and a base dividend without borrowing to preserve a headline payout.
Long commitments raise the discipline test
The filing shows about $9 billion of additional future purchase obligations entered into during 2026, mainly related to liquefied natural gas, vessels and other capacity arrangements. These contractual commitments are not the same as current-period capital expenditure or debt. They do, however, make future cash discipline more important.
LNG access and transportation capacity can diversify markets and create strategic options. Long-dated commitments can also outlast a favourable price environment. Investors should watch whether these arrangements produce attractive margins after shipping, operating and commodity costs, rather than treating contracted capacity as automatic value.
What would confirm the thesis?
The strongest evidence would be stable or rising production after portfolio adjustments, major projects staying on schedule and capital spending remaining within guidance. Operating cash flow should cover investment, the dividend and flexible buybacks without leverage creeping higher.
Price remains the unavoidable variable. A lower realised price combined with lower production would pressure cash from both directions. In that scenario, the percentage-based return framework should reduce buybacks before the balance sheet is used to defend them.
The counter-case is that current distributions are being judged as a durable yield when they are partly a cyclical transfer of higher commodity prices. Cost overruns at Willow, weaker LNG economics or larger contractual requirements could then compete with shareholder returns.
ConocoPhillips’ 45% framework is credible because the arithmetic currently works and the balance sheet is liquid. Its durability depends on discipline when the price tailwind fades. The next proof point is not another large buyback; it is cash coverage through a less favourable commodity environment.
Explore Compound’s earnings hub and our guide to investment diversification.
Reported figures are in US dollars and relate to Q3 or the first nine months of 2026 as stated. Facts come from ConocoPhillips’ 5 November results release and Form 10-Q; calculations and interpretation are Compound’s. Production and price figures use barrels of oil equivalent and company-reported realised prices. Guidance is a management expectation. General information, not personal investment advice.
Cover: Alnitak3, Wikimedia Commons, under CC BY-SA 4.0. Archival photograph taken 10 March 2009; cropped for publication and not presented as a current production image.