AT&T Earnings: Fibre Growth Strengthens the Case, but Cash Still Matters
AT&T raises its earnings outlook as broadband additions hit a record. Its SEC filing reveals a tighter cash-flow story behind the dividend and buybacks.
 Wealth / The Compound journal
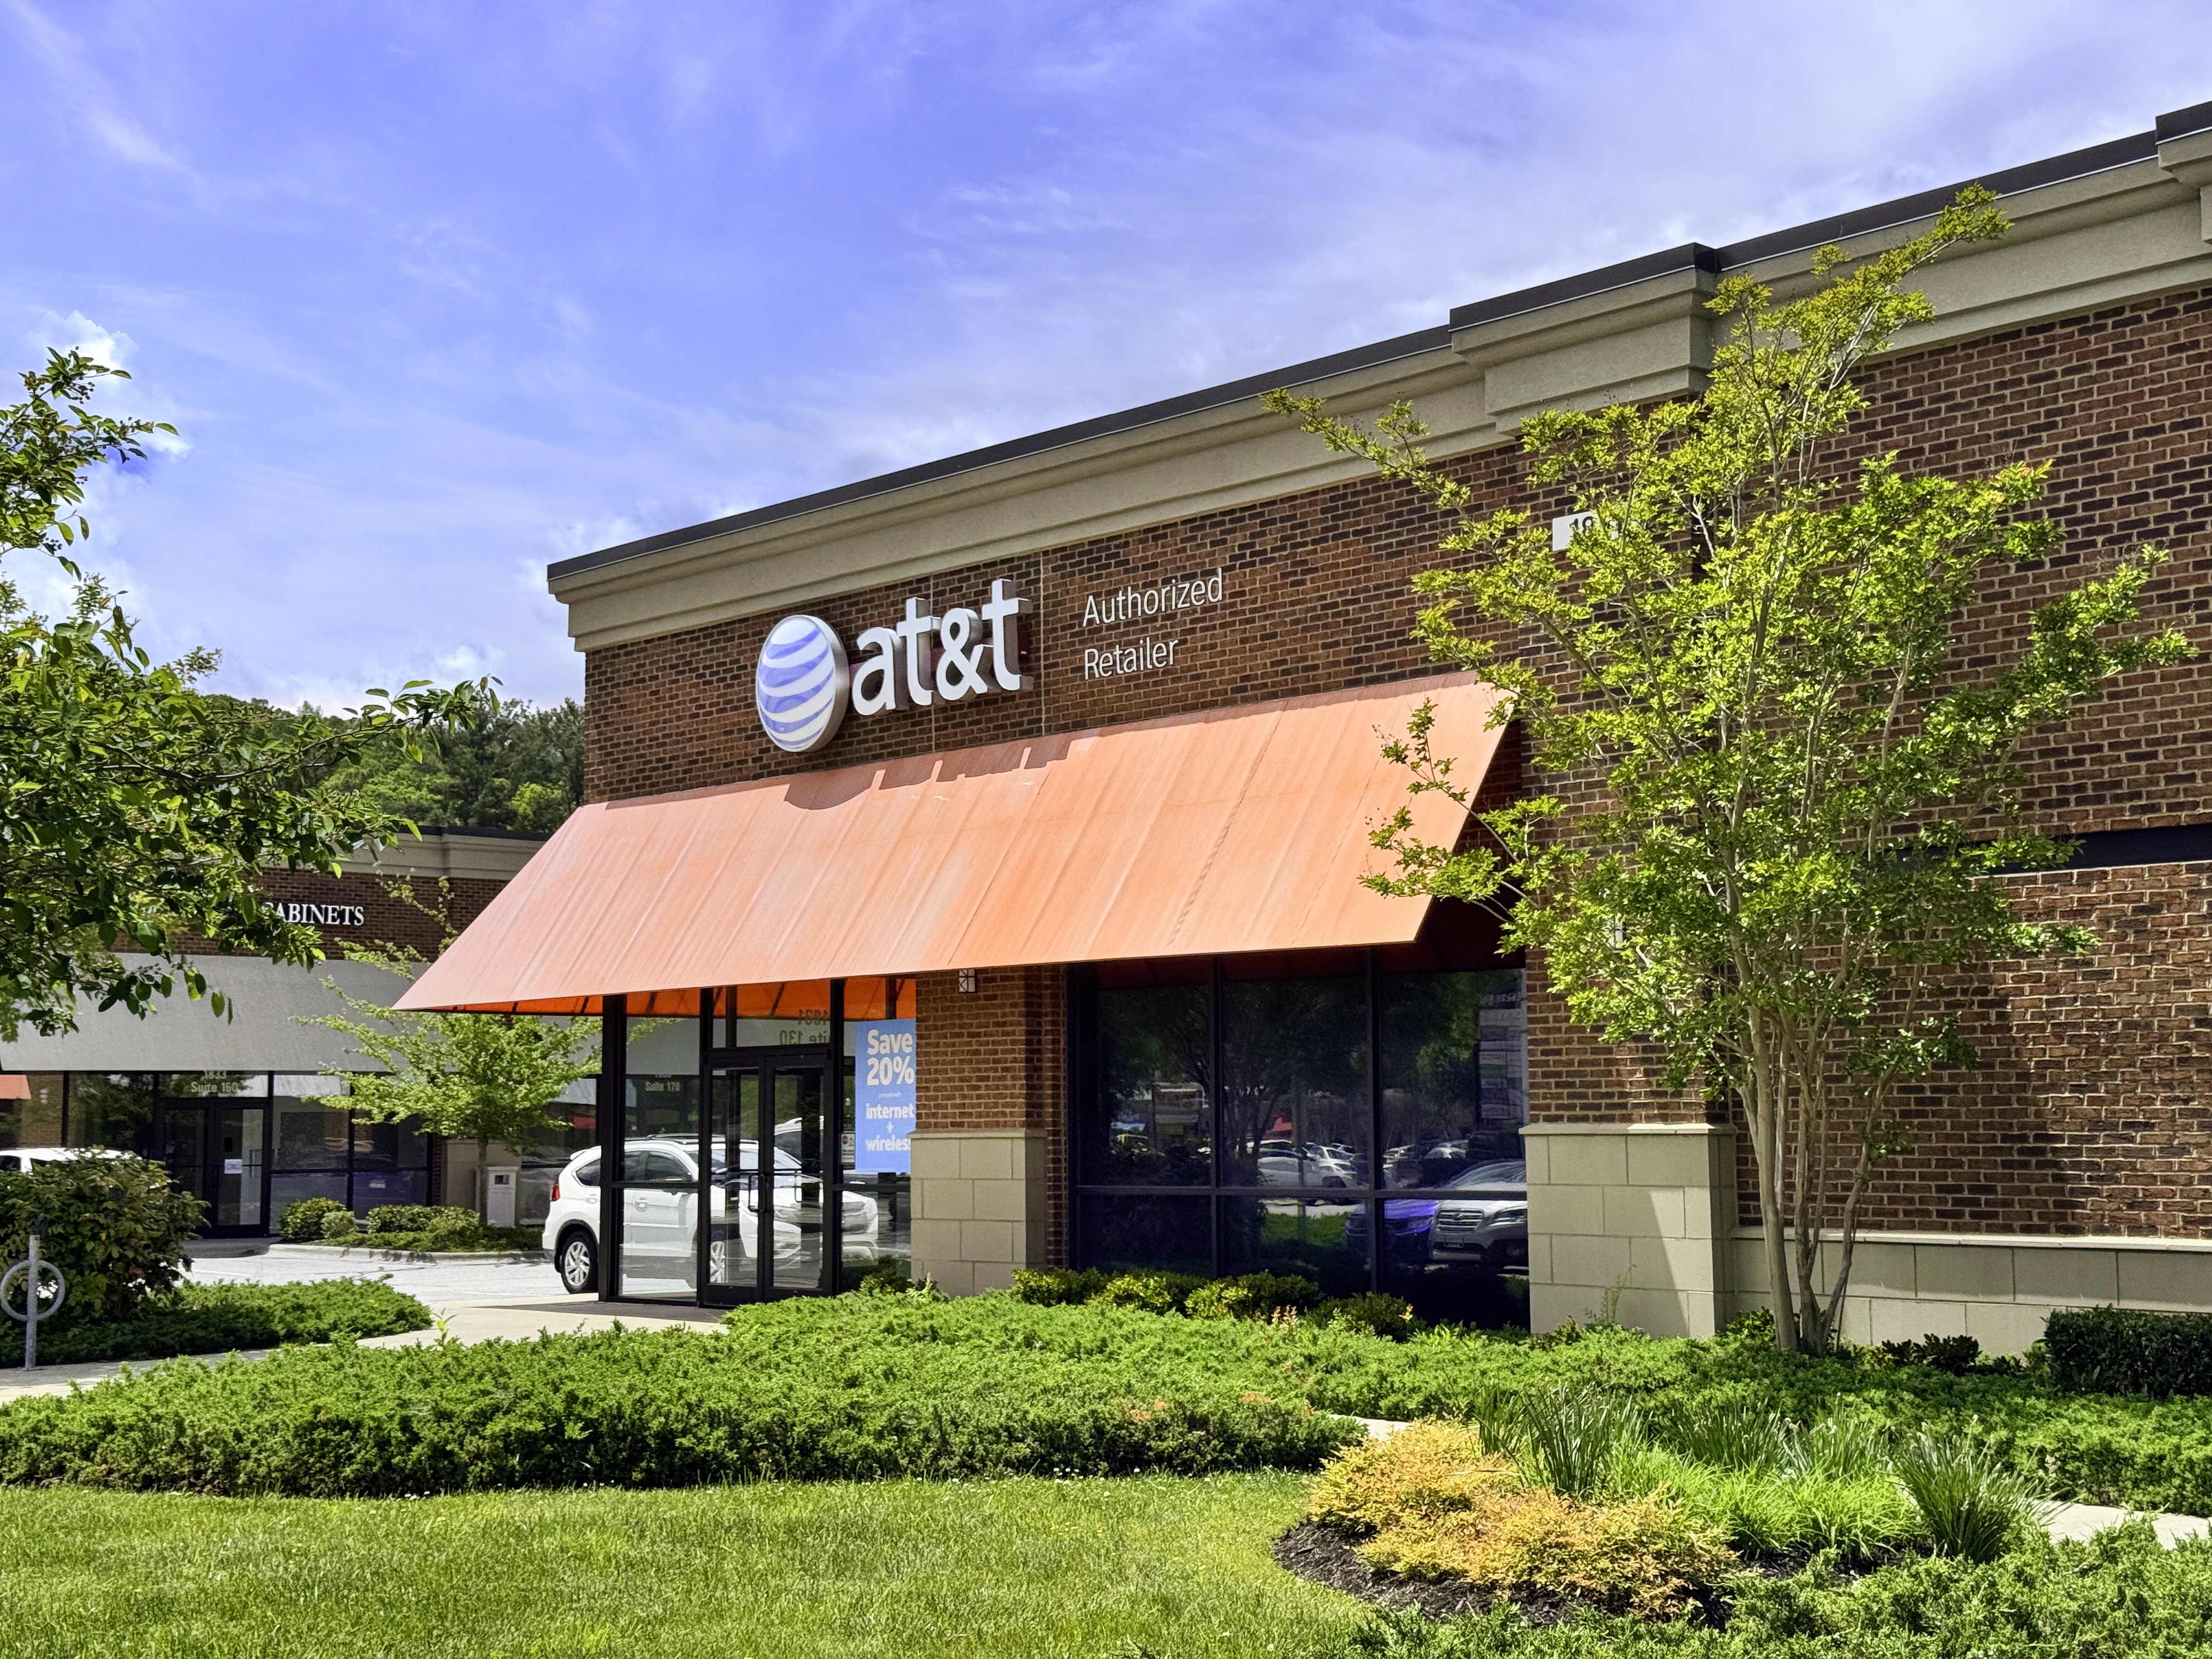
Photo: Harrison Keely / Wikimedia Commons — CC BY 4.0; 6 May 2025; resized · Illustrative image.
AT&T is winning more broadband customers and raising its profit outlook. The harder question is how much of that progress becomes cash available to shareholders after investment and debt commitments.
The company reported third-quarter results on 21 October 2026, covering the three months ended 30 September. Its SEC Form 8-K confirms the release, with separate exhibits for the accounts and non-GAAP reconciliations.
The operating story is encouraging: record internet additions, growing service revenue and a higher adjusted earnings forecast. But quarterly free cash flow improved only modestly, nine-month free cash flow declined, and leverage increased after a major spectrum transaction. Investors need both halves of that picture.
AT&T earnings at a glance
| Metric | Q3 2026 | Q3 2025 |
|---|---|---|
| Revenue | $32.322bn | $30.709bn |
| GAAP operating income | $4.095bn | $6.119bn |
| GAAP diluted EPS, continuing operations | $0.13 | $1.29 |
| GAAP diluted EPS, including discontinued operations | $0.12 | $1.29 |
| Adjusted EPS, non-GAAP | $0.65 | $0.54 |
| Adjusted EBITDA, non-GAAP | $12.505bn | $11.861bn |
| Operating cash flow, continuing operations | $10.519bn | $10.152bn |
| Free cash flow, non-GAAP | $4.953bn | $4.865bn |
Sources: SEC Exhibits 99.2 and 99.3. Adjusted earnings and free cash flow use AT&T’s definitions and are not substitutes for GAAP results.
Revenue increased 5.3%, while adjusted EPS rose 20.4%. The gap between those growth rates makes the earnings reconciliation particularly important.
Fibre and wireless together are the strongest part of the story
AT&T added 769,000 internet connections across consumer and business advanced connectivity: 442,000 fibre and 327,000 fixed wireless. Separately, it added 379,000 postpaid phone customers, with postpaid phone churn of 0.92%.
Those figures measure different services. They should not be described as more than a million unique new households: a household can buy both broadband and mobile.
The strategic attraction is selling more services to the same customer. AT&T reported that 42.8% of its advanced home internet connections also had qualifying AT&T wireless service. That is the share of the relevant installed base, not the percentage of this quarter’s new internet customers buying a bundle.
Our interpretation is that this gives AT&T more opportunities to deepen customer relationships. It does not by itself prove that promotional discounts earn an attractive return. Investors still need to watch revenue per relationship, retention and acquisition costs.
Advanced Connectivity service revenue increased 6.1% to $23.902 billion. Advanced home internet revenue grew 23.4%, although the acquired Lumen customer business contributed to that increase. Treating all of it as organic growth would overstate the evidence.
Why reported earnings fell while adjusted earnings rose
The headline GAAP decline is striking: continuing-operations EPS fell from $1.29 to $0.13. But the comparison includes a DIRECTV disposal gain in the prior year and a $2.6 billion non-cash impairment of the held-for-sale Mexico wireless business this year.
AT&T’s reconciliation removes $0.50 per share of restructuring and impairments and another $0.02 of benefit-related, transaction, legal and other items, taking this quarter’s continuing-operations EPS to $0.65.
That makes adjusted earnings useful for understanding the ongoing business. It does not make an impairment economically meaningless: a write-down is still evidence that an asset’s carrying value could not be supported. Nor should a prior disposal gain be confused with recurring telecom earnings.
The dividend is covered; total shareholder returns demand more scrutiny
AT&T generated $4.953 billion of free cash flow and paid $1.950 billion in common and preferred dividends during the quarter. The company’s free-cash-flow dividend payout ratio was 39.4%, leaving $3.003 billion after dividends.
That supports the current distribution for this period. It is not a guarantee of future dividends, and it is not a dividend yield: yield also depends on the share price.
The broader capital-return picture is tighter. Across the first nine months, free cash flow was $12.129 billion, down from $12.405 billion. Dividends of $5.923 billion and treasury-stock purchases of $7.472 billion together exceeded that free cash flow by approximately $1.266 billion.
This calculation does not establish that AT&T borrowed specifically to fund repurchases; cash is managed across the group. It does show why dividend coverage alone is an incomplete assessment of capital allocation. Our dividend investing guide explains why income investors should consider cash generation and total returns together.
AT&T’s free-cash-flow definition deducts capital expenditure and vendor-financing payments. It does not deduct every use of capital, including acquisitions. That distinction matters in a year of substantial spectrum spending.
Debt and the copper exit remain part of the investment case
Quarter-end net debt was $149.819 billion, with a 3.13-times net-debt-to-adjusted-EBITDA ratio. AT&T attributed the sequential debt increase to closing the EchoStar spectrum transaction. Quarterly interest expense rose 16.4% to $1.979 billion.
Management expects leverage to return to a level consistent with its 2.5-times target range during 2029. That is a forecast, not the current balance-sheet position.
The old copper network also remains a transition cost. Legacy revenue fell 24.5% in the quarter, and management expects Legacy EBITDA to turn negative after 2027 until associated direct costs are substantially removed. Declining sales can arrive before infrastructure costs disappear.
What the higher outlook means
AT&T now expects 2026 adjusted EPS around $2.40, alongside free cash flow of at least $18 billion. It forecasts capital investment of $23–24 billion in 2026, falling to $22–23 billion annually in 2027 and 2028.
The company plans to maintain its $1.11 annualised common dividend per share and repurchase approximately $10 billion of shares during 2026. These remain management plans. Its 2027–2028 outlook excludes the Mexico business it has agreed to sell.
The operating results strengthen the argument that AT&T’s fibre and wireless combination can grow. The investment case still requires that growth to fund the network, support distributions and reduce leverage. The next test is sustained cash-flow growth, not simply another quarter of higher adjusted EPS.
Follow the interactive price chart and financial history on our AT&T stock page, and compare its business with Verizon and T-Mobile.
Photograph: Harrison Keely, 6 May 2025, via Wikimedia Commons, CC BY 4.0. Archival image, resized for publication.